6.8. Markers in plots
Sometimes, it is required to place marker symbols in a plot canvas with subpixel precision. This can for instance be the case, if detected features or calibration marks should be indicated in the plot. Currently, the Qwt-based plot plugins itom1dqwtplot (1D) and itom2dqwtplot support drawing markers.
It is possible to group one or multiple markers in one set that can be assigned a set name. Afterwards it is possible to also delete single sets based on their name or to show the name of the set next to each marker. All markers in one set can have a certain color, shape and size (in pixels). These three properties are given by one style-string of the following form:
1styleString = "CFS"
2#where C is the color character,
3#F is the form or shape character and
4#S is the size as pixel value (optional, default: 5px)
5
6#Additionally, the line width W can be set by
7styleString2 = "CFS;W" #default W = 1px
Colors can be:
Color |
character |
Color |
character |
|---|---|---|---|
Blue |
b |
Magenta |
m |
Green |
g |
Yellow |
y |
Red |
r |
Black |
k |
Cyan |
c |
White |
w |
The shapes can be:
Symbol |
character |
Symbol |
character |
|---|---|---|---|
Dot |
. |
Hexagon |
h |
Circle |
o |
Plus |
+ |
Square |
s |
Star |
* |
Diamond |
d |
Cross |
x |
Triangle right |
> |
Triangle left |
< |
Triangle up |
^ |
Triangle down |
v |
To put a set of markers to an existing plot handle, call the slot plotMarkers of the Qwt designer plugins:
plotHandle.call("plotMarkers", points, styleString [, setName])
Hereby, points is a 2xN, float32, dataObject where the first row are the x-coordinates of the markers (in physical or scale coordinates of the plot), and the second row are the y-coordinates. setName is an optional string as name for the added set of points.
Note
If the origin of the variable plotHandle in the examples does not tell
you something, just a reminder: The commands itom.plot() and
itom.liveImage() return a tuple (index, plotHandle), where
index is the figure index of the opened plot window and plotHandle is
an instance of itom.plotItem that is used to set
properties of the plot, connect to its signals or call slots of the plot.
Dedicated information about the features of a plot can be obtained by
typing:
plotHandle.info()
To delete an existing set of markers, use the slot deleteMarkers:
1plotHandle.call("deleteMarkers", setName) #delete markers within given set
2#or
3plotHandle.call("deleteMarkers") #delete all markers
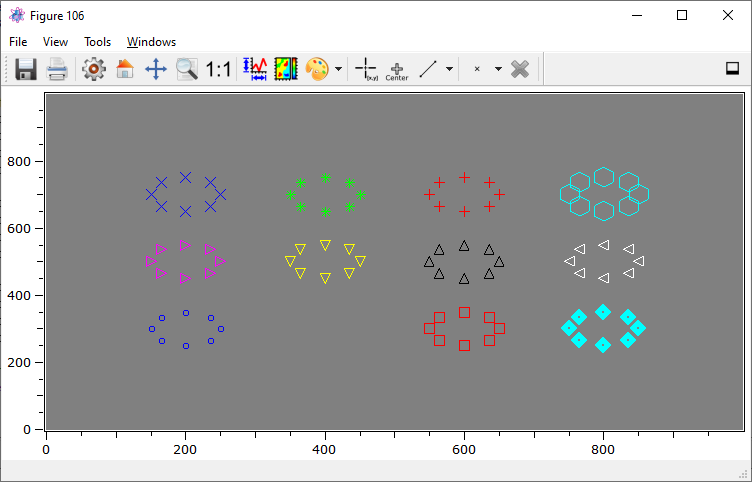
An example with different style strings can be found in the demo script demo/demoMarkers.py:
 1import numpy as np
 2
 3obj = dataObject.zeros([1000,1000])
 4[nr,h] = plot(obj, "itom2dqwtplot")
 5angles = np.arange(0, 2*np.pi, np.pi/4)
 6circles = np.vstack([50 * np.sin(angles), 50 * np.cos(angles)])
 7
 8def move(points, centerX, centerY):
 9    output = dataObject(points).copy()
10    output[0,:] += centerX
11    output[1,:] += centerY
12    return output
13
14#create various markers of different shapes. All markers sets represent a circle whose center is set to different positions.
15h.call("plotMarkers", move(circles,200,300), "b.", "blue, dot, default size: 5, default line width: 1")
16h.call("plotMarkers", move(circles,400,300), "go10", "green, circle") #equal to dot
17h.call("plotMarkers", move(circles,600,300), "rs10", "red, square")
18h.call("plotMarkers", move(circles,800,300), "cd10;5", "cyan, diamond, line width: 5")
19
20h.call("plotMarkers", move(circles,200,500), "m>10", "magenta, triangle right")
21h.call("plotMarkers", move(circles,400,500), "yv10", "yellow, triangle down")
22h.call("plotMarkers", move(circles,600,500), "k^10", "black, triangle up")
23h.call("plotMarkers", move(circles,800,500), "w<10", "white, triangle left")
24
25h.call("plotMarkers", move(circles,200,700), "bx10", "blue, x")
26h.call("plotMarkers", move(circles,400,700), "g*10", "green, star")
27h.call("plotMarkers", move(circles,600,700), "r+10", "red, plus")
28h.call("plotMarkers", move(circles,800,700), "ch20", "cyan, hexagon, size: 20")
29
30#delete the marker set with the name 'green, circle':
31h.call("deleteMarkers", "green, circle")
The result is as follows:
If you want to display the set-name next to each marker, set the property markerLabelsVisible to True:
plotHandle["markerLabelsVisible"] = True