Note
Click here to download the full example code
12.1.10.1.7. Measurement
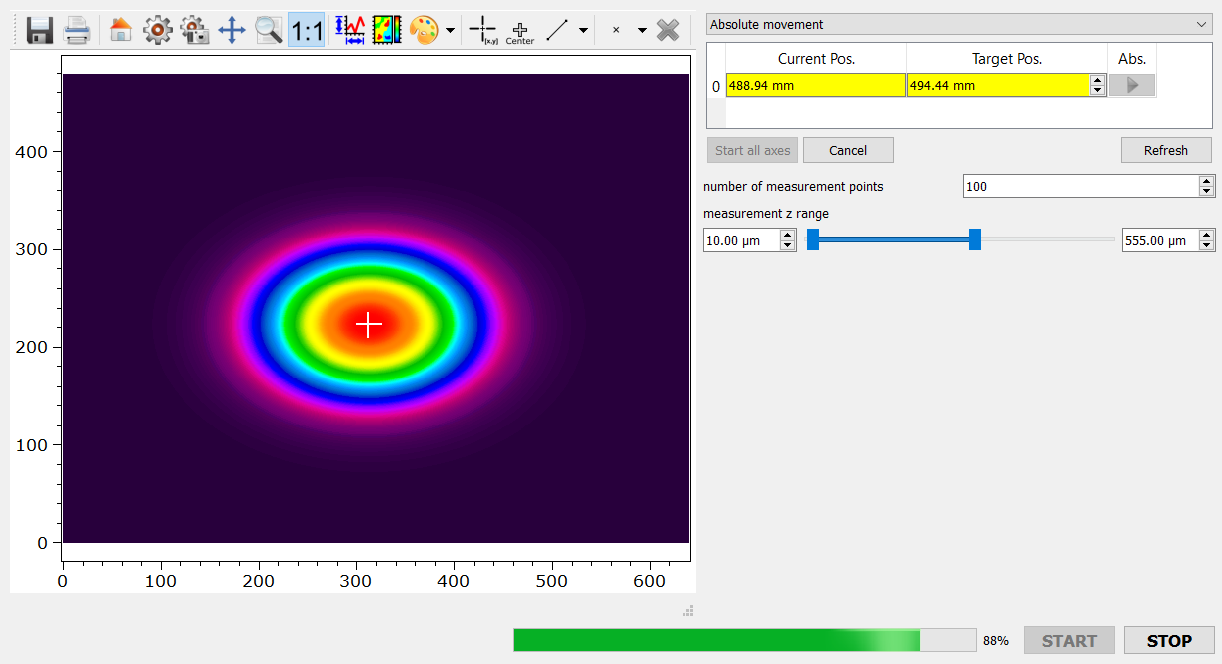
This example shows how a typical measurement automation can be realized in itom.
Let’s say a laser beam is detected by a camera. Different positions are to be approached
with a actuator stage and camera images are to be recorded.
Afterwards the centroid position distribution of the beam is evaluated.
Finally the result is plotted in three different ways using the itom.plot1, matplotlib
and plotly plot engine.
from itom import actuator
from itom import dataIO
from itom import dataObject
from itom import algorithms
from itom import plot1
from itom import plot2

from itom import ui
from itomUi import ItomUi

import numpy as np
import matplotlib.pyplot as plt
import plotly.express as px
This is the main measurement class consisting of following methods:
__init__ : Constructor of the class which opens the
MeasureGUI, connects to a cameraDummyGrabber, connects to a actuator stageDummyMotor.on_pushButtonStart_clicked : Start measurement methods which is connected to the signal
clickedof the buttonpushButtonStartof the GUI.measurementRoutine : Measurement routine which moves the actuator
DummyMotorto the given positions, captures the cameraDummyGrabberimages and evaluates the centroid distribution. Afterwards the live image of the camera is activated again.
class MeasureDemoGUI(ItomUi):
    def __init__(self):
        """Constructor method of the MeasureDemoGUI class."""
        # init the gui
        ItomUi.__init__(self, "MeasureGUI.ui", ui.TYPEWINDOW, deleteOnClose=True)

        # init cam and mot
        self.cam = dataIO("DummyGrabber", imageType="gaussianSpot")
        self.mot = actuator("DummyMotor", numAxis=1)
        self.mot.setParam("speed", 1000)

        # define widget values
        self.gui.spinBoxNumZSteps["value"] = 100
        self.gui.doubleRangeWidgetZRange["minimum"] = 0.0
        self.gui.doubleRangeWidgetZRange["maximum"] = 1000.0
        self.gui.doubleRangeWidgetZRange["minimumValue"] = 10.0
        self.gui.doubleRangeWidgetZRange["maximumValue"] = 555.0

        # show liveimage
        self.cam.startDevice()
        self.gui.camPlot["camera"] = self.cam
        self.gui.camPlot["colorMap"] = "OSIRainbow"
        self.gui.camPlot["keepAspectRatio"] = True

        # access motor controller
        self.gui.MotorAxisController["actuator"] = self.mot
        self.gui.MotorAxisController["numAxis"] = 1
        self.gui.MotorAxisController["defaultAxisType"] = "TypeLinear"

        # connect
        # self.gui.pushButtonStart.connect("clicked()", self.startMeasure)

        # define measure data object
        self.imageStack = None
        self.centroidData = None

        # connect stop button to interrupt
        self.gui.pushButtonStop.invokeKeyboardInterrupt("clicked()")

        # show the gui
        self.gui.show()
        self.gui.call("statusBar").call("showMessage", "Initialization finished.", 5000)

        return

    @ItomUi.autoslot("")
    def on_pushButtonStart_clicked(self):
        """Function trigger by pushButtonStart"""
        self.gui.call("statusBar").call("showMessage", "Start Measurement", 5000)
        with self.disableGui([self.gui.pushButtonStart], showWaitCursor=False):
            minVal = self.gui.doubleRangeWidgetZRange["minimumValue"]
            maxVal = self.gui.doubleRangeWidgetZRange["maximumValue"]
            steps = self.gui.spinBoxNumZSteps["value"]
            self.measurementRoutine(minVal, maxVal, steps)
        self.gui.call("statusBar").call("showMessage", "Stop Measurement", 5000)
        return

    def measurementRoutine(self, zMin: float, zMax: float, numZSteps: int):
        """Measurement routine along input z range

        Args:
            zMin (float): Minimum z position
            zMax (float): Maximum z position
            numZSteps (int): Number of z positions
        """
        # Create z positions vector
        zVec = np.linspace(zMin, zMax, num=numZSteps)

        # disable camera auto grabbing
        self.cam.disableAutoGrabbing()

        # define measurement data object
        bpp = self.cam.getParam("bpp")
        if bpp == 8:
            dtype = "uint8"
        else:
            dtype = "uint16"
        self.imageStack = dataObject([len(zVec), self.cam.getParam("sizey"), self.cam.getParam("sizex")], dtype)
        self.centroidData = dataObject([2, len(zVec)], "float32")

        # centroidMarker dObj
        centroidMarker = dataObject([2, 1], "float32")

        # loop for all z positions
        for idx, z in enumerate(zVec):
            self.gui.call("statusBar").call("showMessage", "z measurement posotion {}".format(z), 5000)
            # goto new motor position
            self.mot.setPosAbs(0, z)

            # acquire image
            d = dataObject()
            self.cam.acquire()
            self.cam.copyVal(d)

            # eval the centroid
            cYI, cXI, cY, cX = algorithms.centroidXY(d)
            # add to data stack
            self.imageStack[idx, :, :] = d
            self.centroidData[0, idx] = cX
            self.centroidData[1, idx] = cY

            # plot current image and centroid
            self.gui.camPlot["source"] = d
            centroidMarker[0, 0] = cX
            centroidMarker[1, 0] = cY
            self.gui.camPlot.call("deleteMarkers")
            self.gui.camPlot.call("plotMarkers", centroidMarker, "w+25;2", "centroid", 0)
            self.gui.progressBar["value"] = idx / (len(zVec) - 1) * 100

        self.cam.enableAutoGrabbing()
        self.gui.camPlot.call("deleteMarkers")
        self.gui.camPlot["camera"] = self.cam

        # define imageStack
        self.imageStack.setAxisDescription(0, "z axis of actuator")
        self.imageStack.setAxisDescription(1, "y axis")
        self.imageStack.setAxisDescription(2, "x axis")
        self.imageStack.setAxisUnit(0, "mm")
        self.imageStack.setAxisUnit(1, "\xb5m")
        self.imageStack.setAxisUnit(2, "\xb5m")

        # calc meta info
        zScale = (zMax - zMin) / (numZSteps - 1)
        zOffset = -(zVec[0] / zScale)
        self.imageStack.setAxisScale(0, zScale)
        self.imageStack.setAxisOffset(0, zOffset)
        self.imageStack.setAxisScale(1, 17e-3)  # pixel pitch of 17 \xb5m
        self.imageStack.setAxisScale(2, 17e-3)  # pixel pitch of 17 \xb5m
        self.imageStack.valueDescription = "intensity"
        self.imageStack.valueUnit = "counts"

        # plot imagestack
        plot2(self.imageStack)
        self.centroidData.setAxisScale(1, zScale)
        self.centroidData.setAxisOffset(1, zOffset)
        self.centroidData.valueDescription = "centroid position"
        self.centroidData.valueUnit = "mm"
        self.centroidData.setTag("legendTitle0", "x centroid")
        self.centroidData.setTag("legendTitle1", "y centroid")

        # plot x, y as lines
        plot1(self.centroidData, properties={"legendPosition": "Right", "grid": "GridMajorXY"})

        # plot y vs. x
        yData = self.centroidData[0, :].squeeze()
        xData = self.centroidData[1, :].squeeze()
        yData.valueDescription = "y centroid position"
        xData.valueDescription = "x centroid position"
        plot1(
            yData,
            xData=xData,
            properties={
                "keepAspectRatio": True,
                "grid": "GridMajorXY",
                "lineStyle": "NoPen",
                "lineSymbol": "XCross",
            },
        )

        # plot using matplotlib
        xData = np.squeeze(np.array(xData))
        yData = np.squeeze(np.array(yData))

        plt.figure()
        plt.scatter(xData, yData)
        plt.xlabel("x centroid /mm")
        plt.ylabel("y centroid /mm")
        plt.show()

        # plot using plotly
        figly = px.scatter(x=xData, y=yData, labels={"x": "x centroid /mm", "y": "y centroid /mm"})
        figly.show()


# -------------------------------
if __name__ == "__main__":
    demo = MeasureDemoGUI()
Total running time of the script: ( 0 minutes 0.967 seconds)