Note
Click here to download the full example code
12.1.10.5.9. Interactive shape picker
This demo shows how to let the user select a certain number of shapes in a plot.
The shapes are then returned as list of shapes. This list can also be assigned
to the geometricShapes property of any other plot to display them in another plot.
The plotItem.drawAndPickElements method is used for this demo. It accepts
any kind of shape (plotItem.Primitive …) besides plotItem.PrimitiveMultiPointPick.
Use instead PrimitivePoint or use the similar method plotItem.pickPoints
if the user should select a arbitrary number of single points.
from itom import dataObject
from itom import plot
from itom import shape
from itom import ui
from itom import plotItem
from typing import Tuple
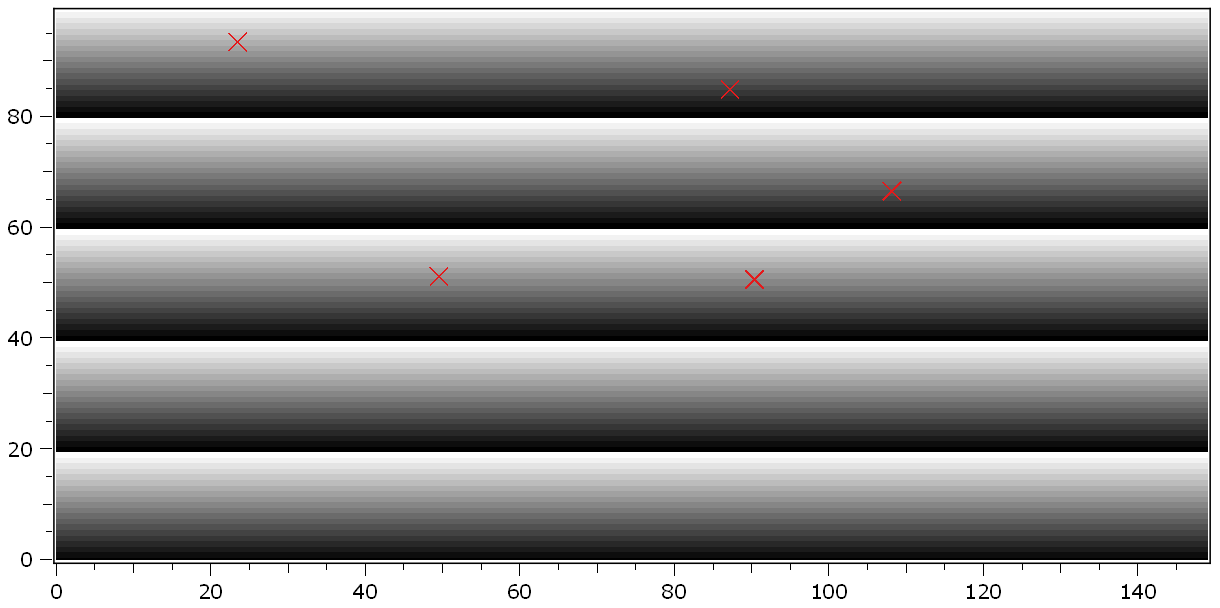
elementList = [
(plotItem.PrimitivePoint, 5),
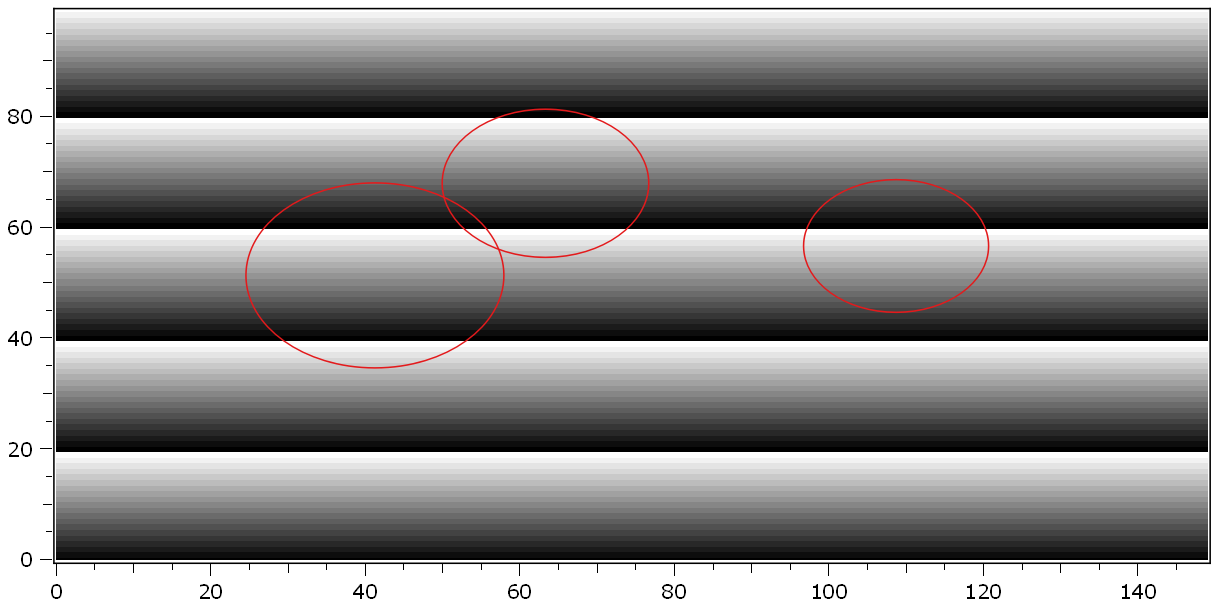
(plotItem.PrimitiveCircle, 3),
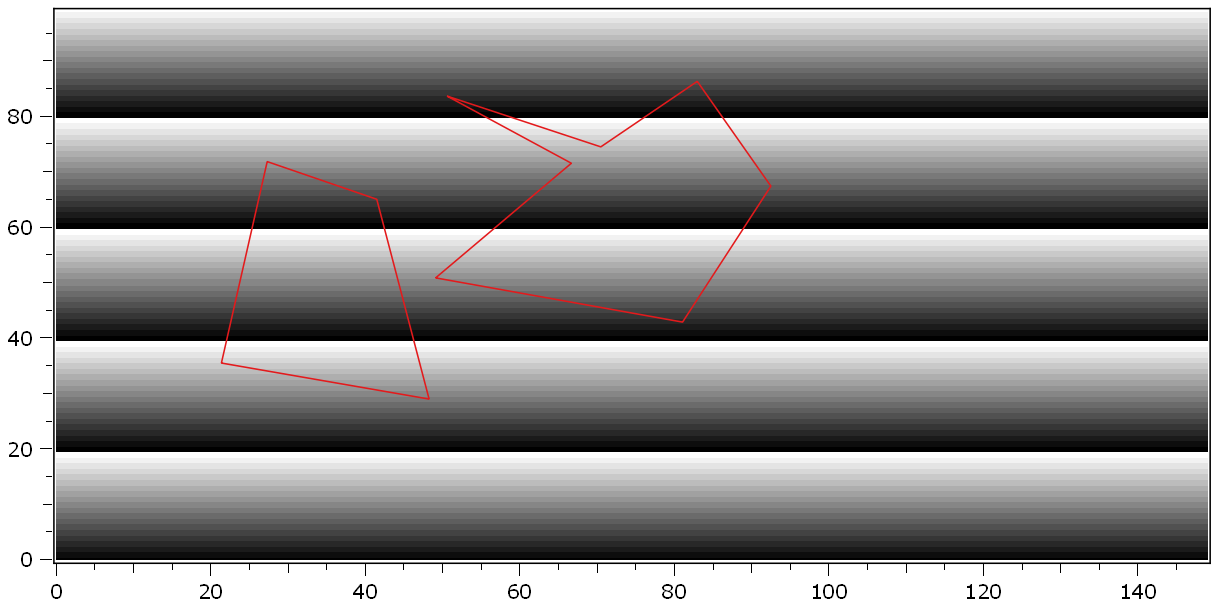
(plotItem.PrimitivePolygon, 2),
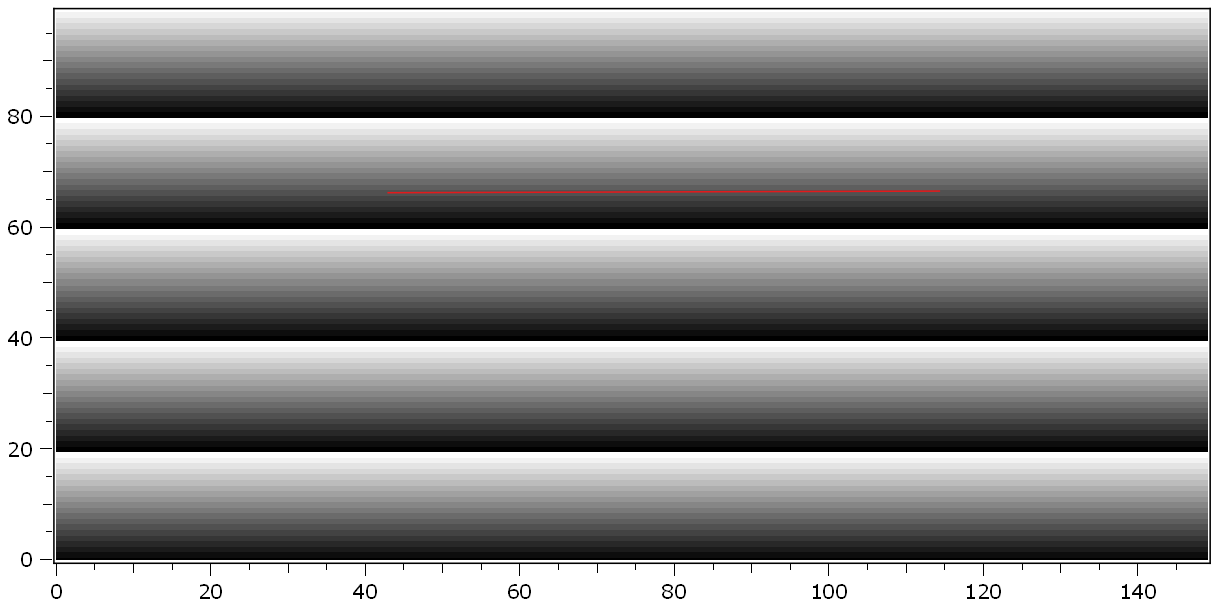
(plotItem.PrimitiveLine, 1)
]
for shapeType, numShapes in elementList:
img = dataObject.zeros([100, 150], "float32")
for r in range(img.shape[0]):
img[r, :] = (r % 20) * 0.02
[i, h] = plot(img)
try:
polygons: Tuple[shape] = h.drawAndPickElements(shapeType, numShapes)
except RuntimeError as ex:
print(str(ex))
ui.msgWarning("Abort", "The user interaction has been aborted")
break
else:
print("The following shapes have been selected:\n--------------------")
for p in polygons:
print(str(p))
print("---------------------")