Note
Click here to download the full example code
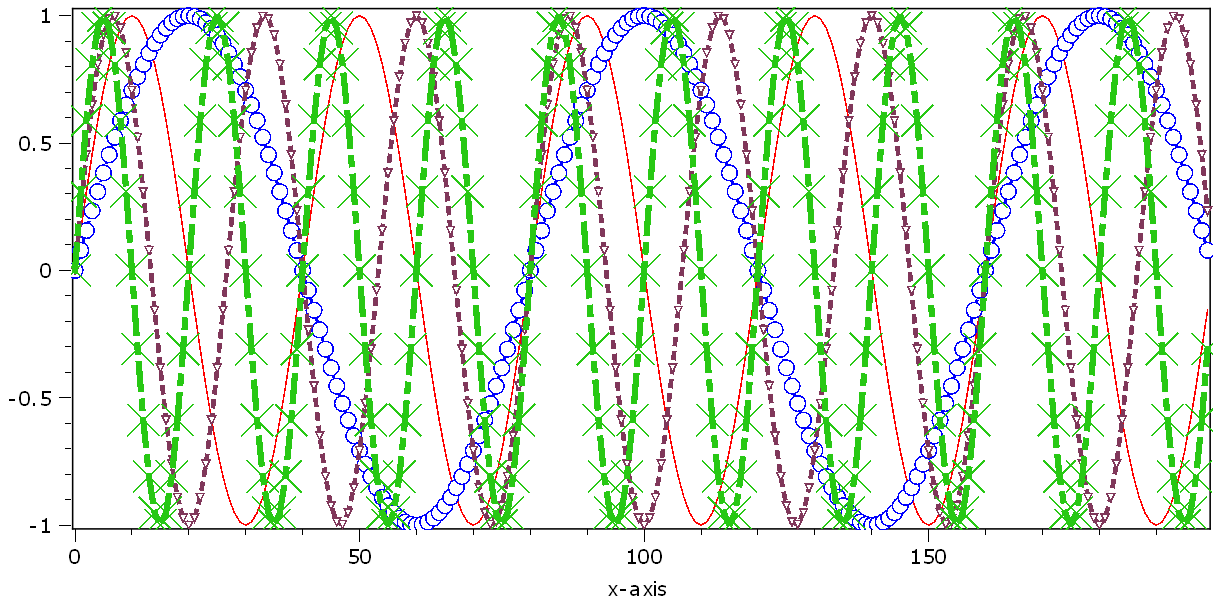
12.1.10.5.16. 1D Line properties
This demo shows how to individually set the property of each line. In most cases, the property can both be set for each line and globally as property of the plot. If the latter is set, all line properties are reset to the same global value!
import numpy as np
from itom import plot1
from itom import dataObject
from itom import rgba
Create a 1D sine curve demo data and plot it.
sine = np.sin(np.arange(0, 10 * np.pi, (1 / 20) * np.pi))
sine2 = np.sin(np.arange(0, 5 * np.pi, (1 / 40) * np.pi))
sine3 = np.sin(np.arange(0, 15 * np.pi, (3 / 40) * np.pi))
sine4 = np.sin(np.arange(0, 20 * np.pi, (1 / 10) * np.pi))
foursines = dataObject([4, len(sine)], "float64")
foursines[0, :] = sine
foursines[1, :] = sine2
foursines[2, :] = sine3
foursines[3, :] = sine4

[i, h] = plot1(foursines)
Get the current properties of the first line.
print("lineStyle", h.call("getCurveProperty", 0, "lineStyle"))  # enumeration Qt::PenStyle
print("lineWidth", h.call("getCurveProperty", 0, "lineWidth"))
print("lineColor", h.call("getCurveProperty", 0, "lineColor"))
print("lineJoinStyle", h.call("getCurveProperty", 0, "lineJoinStyle"))  # enumeration Qt::PenJoinStyle
print("lineCapStyle", h.call("getCurveProperty", 0, "lineCapStyle"))  # enumeration  Qt::PenCapStyle
print("lineSymbolSize", h.call("getCurveProperty", 0, "lineSymbolSize"))
print("lineSymbolStyle", h.call("getCurveProperty", 0, "lineSymbolStyle"))  # enumeration Itom1DQwtPlot::Symbol
lineStyle 1
lineWidth 1.0
lineColor rgba(31,120,180 alpha:255)
lineJoinStyle 64
lineCapStyle 16
lineSymbolSize 0
lineSymbolStyle 0
Change some styles.
h.call("setCurveProperty", 0, "lineStyle", "SolidLine")
h.call("setCurveProperty", 1, "lineStyle", "DashLine")
h.call("setCurveProperty", 2, "lineStyle", "DotLine")
h.call("setCurveProperty", 3, "lineStyle", "DashDotLine")
Change some widths.
h.call("setCurveProperty", 0, "lineWidth", 1)
h.call("setCurveProperty", 1, "lineWidth", 2)
h.call("setCurveProperty", 2, "lineWidth", 3)
h.call("setCurveProperty", 3, "lineWidth", 4)
Change some colors.
h.call("setCurveProperty", 0, "lineColor", "red")
h.call("setCurveProperty", 1, "lineColor", "blue")
h.call("setCurveProperty", 2, "lineColor", rgba(128, 55, 90))
h.call("setCurveProperty", 3, "lineColor", rgba(40, 200, 20))
Change some symbols.
h.call("setCurveProperty", 0, "lineSymbolStyle", "NoSymbol")
h.call("setCurveProperty", 1, "lineSymbolStyle", "Ellipse")
h.call("setCurveProperty", 2, "lineSymbolStyle", "DTriangle")
h.call("setCurveProperty", 3, "lineSymbolStyle", "XCross")
Change some cap styles.
h.call("setCurveProperty", 1, "lineSymbolSize", 10)
h.call("setCurveProperty", 2, "lineSymbolSize", 5)
h.call("setCurveProperty", 3, "lineSymbolSize", 20)
Total running time of the script: ( 0 minutes 0.315 seconds)