Note
Click here to download the full example code
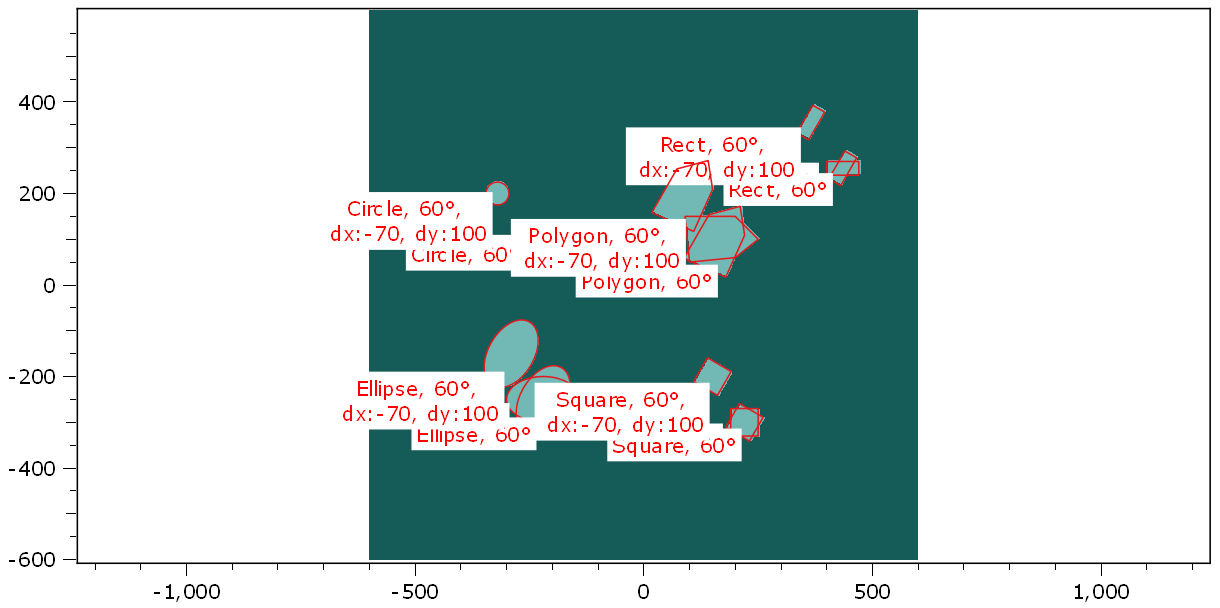
12.1.10.5.18. Draw and transform shapes
In this demo script, multi shapes are created. These shapes are then rotated and translated by various angles and distances and displayed in one plot figure.
The overlay image of the plot is finally set to a masked object, where the masked area ist equal to the union of all shapes, visible at the canvas.
import numpy as np
from itom import dataObject
from itom import shape
from itom import plot
Define a dataObject and plot using it as a “background”.
dObj = dataObject.zeros([1200, 1200], "uint8")
dObj.axisOffsets = (600, 600)
[i, h] = plot(
    dObj,
    properties={
        "colorMap": "viridis",
        "geometricShapesLabelsVisible": True,
        "keepAspectRatio": True,
    },
)

base_shapes = []
This is one option to create shapes.
rect = shape(shape.Rectangle, (400, 240), (470, 270))
rect.name = "Rect"
ellipse = shape(shape.Ellipse, (-300, -300), (-140, -200))
ellipse.name = "Ellipse"
square = shape(shape.Square, (220, -300), 60)
square.name = "Square"
circle = shape(shape.Circle, (-250, 100), 25)
circle.name = "Circle"
polygons = np.array([[100, 200, 250, 200, 90], [50, 60, 100, 150, 150]])
polygon = shape(shape.Polygon, polygons)
polygon.name = "Polygon"
This is another possibility, using static methods
rect = shape.createRectangle(corner1=(400, 240), corner2=(470, 270), name="Rect")
ellipse = shape.createEllipse(corner1=(-300, -300), corner2=(-140, -200), name="Ellipse")
# rectangle and ellipses can also be created with the arguments center and size:
ellipse = shape.createEllipse(
    center=(0.5 * (-300 - 140), 0.5 * (-300 - 200)),
    size=(-140 + 300, -200 + 300),
    name="Ellipse",
)
square = shape.createSquare(center=(220, -300), sideLength=60, name="Square")
circle = shape.createCircle(center=(-250, 100), radius=25, name="Circle")
polygons = np.array([[100, 200, 250, 200, 90], [50, 60, 100, 150, 150]])
polygon = shape.createPolygon(polygons, name="Polygon")
Push all base shapes in the tuple base_shapes. These base shapes can not be moved, rotated or resized (and thus not be selected).
base_shapes = [rect, ellipse, square, circle, polygon]

for b in base_shapes:
    b.flags = shape.MoveLock | shape.RotateLock | shape.ResizeLock

all_shapes = base_shapes.copy()
Rotate all base shapes by 60 degree (around its center). These rotated elements can only be rotated.
rotated_shapes = []
for base_shape in base_shapes:
    temp = base_shape.copy()
    temp.rotateDeg(60)
    temp.flags = shape.MoveLock | shape.ResizeLock
    temp.name += ", 60\xb0"
    rotated_shapes.append(temp)
all_shapes += rotated_shapes
Move all rotated shapes by dx = -70, dy = 100. These objects can be rotated, resized and moved.
rotated_translated_shapes = []
for rotated_shape in rotated_shapes:
    temp = rotated_shape.copy()
    temp.translate([-70, 100])
    temp.flags = 0
    temp.name += ",\n dx:-70, dy:100"
    rotated_translated_shapes.append(temp)
all_shapes += rotated_translated_shapes
Display all shapes on the plot figure.
h["geometricShapes"] = all_shapes

# create a mask object (uint8, masked pixels are set to 255, the rest is 0) from all shapes
mask = dObj.createMask(all_shapes)

# display the mask as overlay of the plot
h["overlayImage"] = mask
Total running time of the script: ( 0 minutes 0.401 seconds)