Note
Click here to download the full example code
12.1.10.5.14. Draw markers
In this example, you will learn how to mark points in 1d or 2d plots
with markers of varying shapes, colors and sizes. Multiple markers
can be set in one group with a corresponding name. It is also possible
to delete such groups using its name again.
For this feature, the designer plugin itom1dqwtplot and itom2dqwtplot
have the slots plotMarkers and deleteMarkers.
The slot deleteMarkers is defined as follows:
myPlot.call("deleteMarkers", groupname)
The slot plotMarkers is defined as follows:
myPlot.call("plotMarkers", points, style, groupname = "")
where:
points is a 2xN
dataObjectwith N points. The first row is the x-coordinate, the 2nd row the y-coordinate.style is defined as follows:
r*20orr*20;2, whereris the color,*the shape and20the size of the shape in pixel. Optionally 2 is the line width.
Possible colors are:
b |
blue |
g |
green |
r |
red |
c |
cyan |
m |
magenta |
y |
yellow |
k |
black |
w |
white |
Possible shapes are:
. |
point |
o |
ellipse |
s |
square |
d |
diamond |
> |
triangle, tip to the right |
v |
triangle, tip to the bottom |
^ |
triangle, tip to the top |
< |
triangle, tip to the left |
x |
x-cross |
* |
star |
+ |
cross |
h |
hexagon |
import numpy as np
from itom import dataObject
from itom import plot
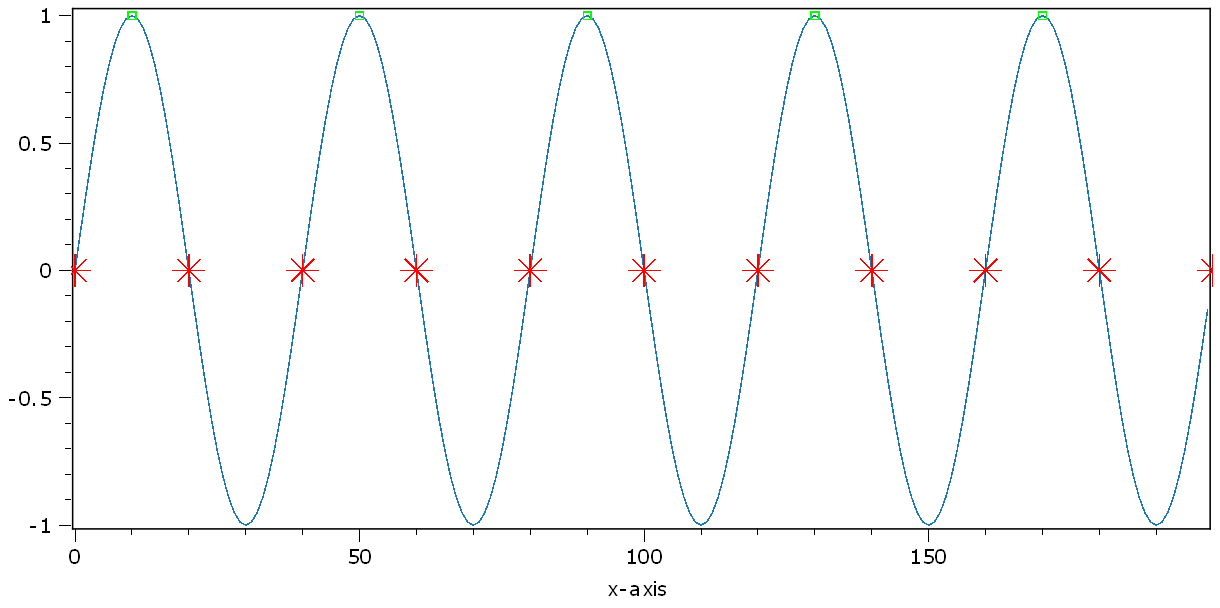
# 1d sine
sine = dataObject(np.sin(np.arange(0, 10 * np.pi, (1 / 20) * np.pi)))
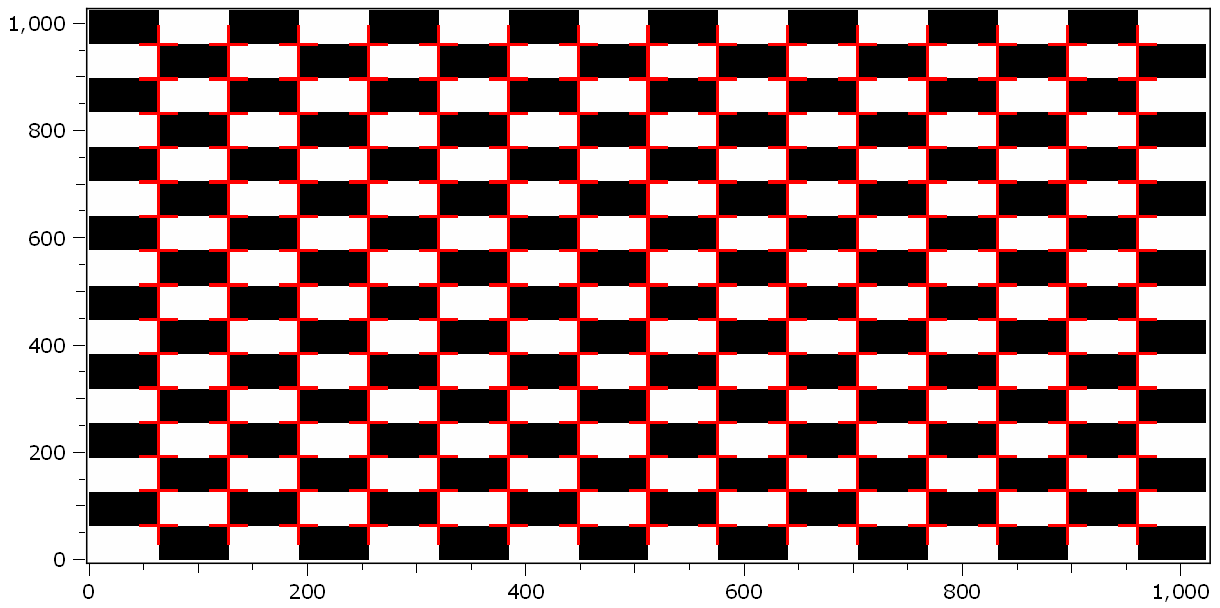
# 3d object with two different chessboards in both planes
chessboard = dataObject.zeros([2, 1024, 1024], "uint8")
color = 0
for r in range(0, 1024, 64):
color = 255 if color == 0 else 0 # invert color
for c in range(0, 1024, 64):
chessboard[0, r : r + 64, c : c + 64] = color
color = 255 if color == 0 else 0 # invert color
for r in range(0, 1024, 128):
color = 255 if color == 0 else 0 # invert color
for c in range(0, 1024, 128):
chessboard[1, r : r + 128, c : c + 128] = color
color = 255 if color == 0 else 0 # invert color
[i1, h1] = plot(sine)
[i2, h2] = plot(chessboard)
Mark all zero values of the sine with red stars (size: 20). The name of this set of 11 points is called zero-points.
zeros = dataObject.zeros([2, 11], "float32")
for i in range(0, 11):
    zeros[0, i] = 20 * i
h1.call("plotMarkers", zeros, "r*20", "zero-points")

# in order to delete the set, call
h1.call("deleteMarkers", "zero-points")
# and set it again
h1.call("plotMarkers", zeros, "r*20", "zero-points")
Mark all local maximas of the sine with green dots (size: 5). The name of this set is local-maximas.
maximas = dataObject.zeros([2, 5], "float32")
for i in range(0, 5):
    maximas[1, i] = 1
    maximas[0, i] = 10 + 40 * i
h1.call("plotMarkers", maximas, "gs5", "local-maximas")
Put crosses at all corner points of the chessboard. Please consider, that both chessboards in both planes have different marker patterns.
[X1, Y1] = np.meshgrid(range(64, 1024, 64), range(64, 1024, 64))
[X2, Y2] = np.meshgrid(range(128, 1024, 128), range(128, 1024, 128))

corners1 = dataObject([2, 225], "int32")
corners1[0, :] = X1.flatten()
corners1[1, :] = Y1.flatten()

corners2 = dataObject([2, 49], "int32")
corners2[0, :] = X2.flatten()
corners2[1, :] = Y2.flatten()

h2.call("plotMarkers", corners1, "r+25;2", "corners1", 0)  # draw to plane 0 only
h2.call("plotMarkers", corners2, "c+25", "corners2", 1)  # draw to plane 1 only
Total running time of the script: ( 0 minutes 0.322 seconds)