Note
Click here to download the full example code
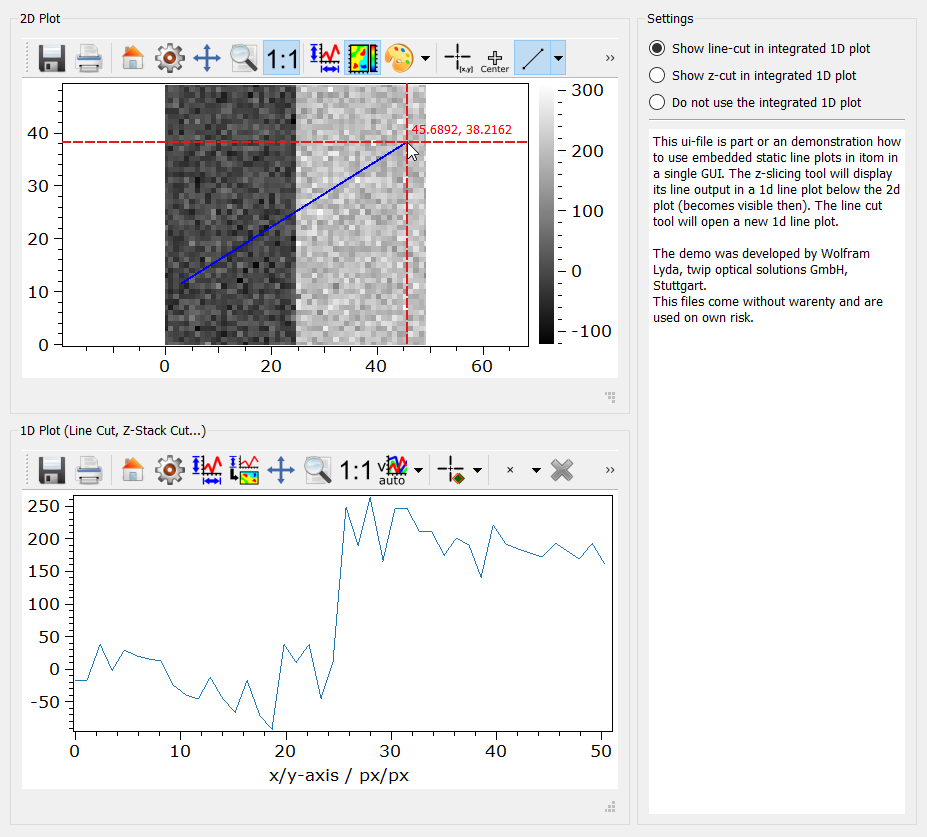
12.1.10.8.17. Embedded plots
This script shows how to use embedded static line plots in itom in a single GUI.
The z-slicing tool will display its line output in a 1D line plot below the 2D
plot (becomes visible then). The line cut tool will open a new 1D line plot.
from itom import dataObject
from itomUi import ItomUi
from itom import ui


class EmbeddedPlots(ItomUi):
    def __init__(self, dataObj: dataObject):

        uiFile = r"embedded2DwLinePlot.ui"
        ItomUi.__init__(
            self,
            uiFile,
            ui.TYPEWINDOW,
            childOfMainWindow=True,
            deleteOnClose=True,
        )

        self.gui.plot2D["source"] = dataObj

    def show(self, modalLevel=0):
        self.gui.show(modalLevel)

    @ItomUi.autoslot("bool")
    def on_radioNothing_toggled(self, checked: bool):
        if checked:
            self.gui.plot2D["lineCutPlotItem"] = None
            self.gui.plot2D["zSlicePlotItem"] = None
            self.gui.group1D["enabled"] = False
            self.gui.plot1D["source"] = dataObject()

    @ItomUi.autoslot("bool")
    def on_radioZCut_toggled(self, checked: bool):
        if checked:
            self.gui.plot2D["lineCutPlotItem"] = None
            self.gui.plot2D["zSlicePlotItem"] = self.gui.plot1D
            self.gui.group1D["enabled"] = True

    @ItomUi.autoslot("bool")
    def on_radioLineCut_toggled(self, checked: bool):
        if checked:
            # if the same plot is used for different sub-plots, invalidate one type at first
            # before you assign the new one
            self.gui.plot2D["zSlicePlotItem"] = None  # invalidating
            self.gui.plot2D["lineCutPlotItem"] = self.gui.plot1D  # assigning new one
            self.gui.group1D["enabled"] = True


def createSampleObject():
    tempData = dataObject.randN([10, 50, 50], "float32") * 100
    for i in range(0, tempData.shape[0]):
        # tempData[i, :, :] += i - tempData.shape[0] / 20
        tempData[i, :, 25:50] += 200

    return tempData


if __name__ == "__main__":
    modeID = 1  # use 0 for lateral slice example or 1 for zSlice example
    win = EmbeddedPlots(createSampleObject())
    win.show()
Total running time of the script: ( 0 minutes 0.724 seconds)