Note
Click here to download the full example code
12.3.10.1.15. Colorbar tick labelling
Produce custom labelling for a colorbar.
Contributed by Scott Sinclair
import matplotlib.pyplot as plt
import numpy as np
from matplotlib import cm
from numpy.random import randn
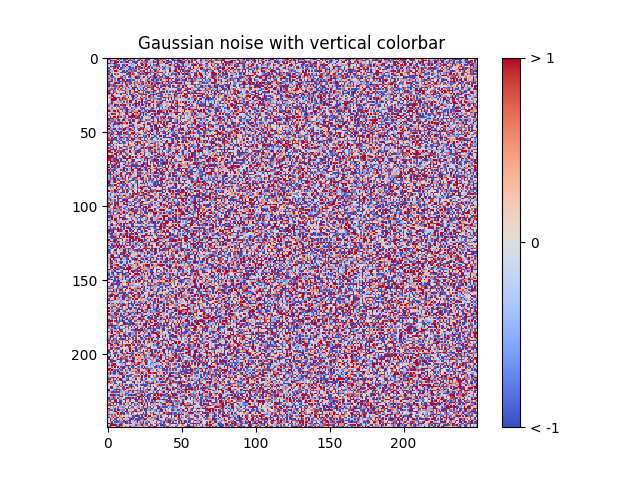
# Make plot with vertical (default) colorbar
fig, ax = plt.subplots()
data = np.clip(randn(250, 250), -1, 1)
cax = ax.imshow(data, interpolation="nearest", cmap=cm.coolwarm)
ax.set_title("Gaussian noise with vertical colorbar")
# Add colorbar, make sure to specify tick locations to match desired ticklabels
cbar = fig.colorbar(cax, ticks=[-1, 0, 1])
cbar.ax.set_yticklabels(["< -1", "0", "> 1"]) # vertically oriented colorbar
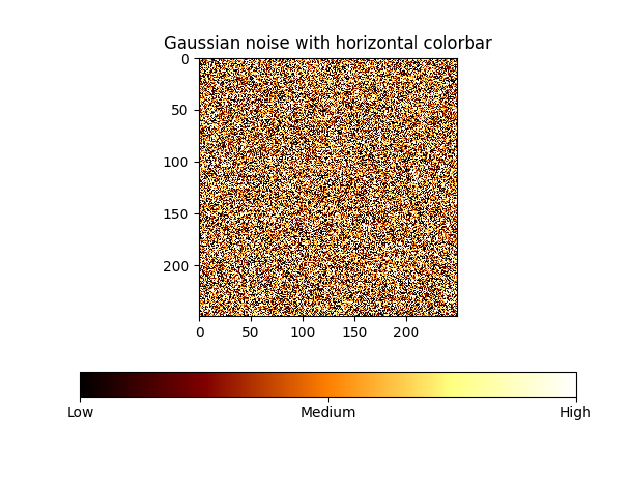
# Make plot with horizontal colorbar
fig, ax = plt.subplots()
data = np.clip(randn(250, 250), -1, 1)
cax = ax.imshow(data, interpolation="nearest", cmap=cm.afmhot)
ax.set_title("Gaussian noise with horizontal colorbar")
cbar = fig.colorbar(cax, ticks=[-1, 0, 1], orientation="horizontal")
cbar.ax.set_xticklabels(["Low", "Medium", "High"]) # horizontal colorbar
plt.show()
Total running time of the script: ( 0 minutes 0.276 seconds)