Note
Click here to download the full example code
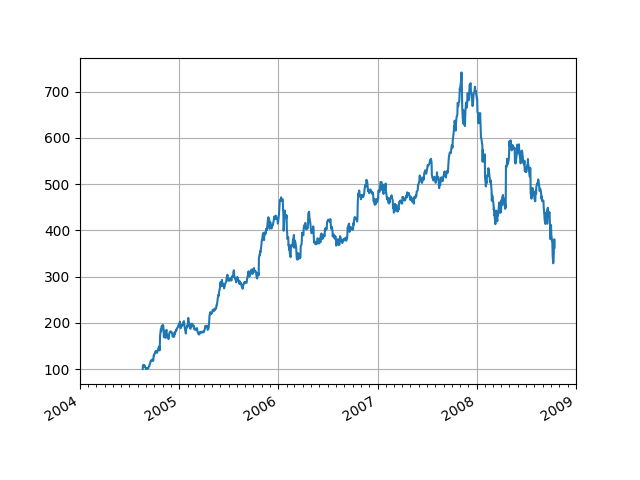
12.3.10.1.17. Date axis
Load a numpy record array from yahoo csv data with fields date, open, close, volume, adj_close from the mpl-data/example directory. The record array stores the date as an np.datetime64 with a day unit (‘D’) in the date column.
import numpy as np
import matplotlib.pyplot as plt
import matplotlib.dates as mdates
import matplotlib.cbook as cbook
import matplotlib

years = mdates.YearLocator()  # every year
months = mdates.MonthLocator()  # every month
yearsFmt = mdates.DateFormatter("%Y")


if matplotlib.__version__ < "3.3.0":
    with cbook.get_sample_data("goog.npz") as datafile:
        r = np.load(datafile)
else:
    r = cbook.get_sample_data("goog.npz", np_load=True)

r = r["price_data"].view(np.recarray)

fig, ax = plt.subplots()
ax.plot(r.date, r.adj_close)

# format the ticks
ax.xaxis.set_major_locator(years)
ax.xaxis.set_major_formatter(yearsFmt)
ax.xaxis.set_minor_locator(months)

# round to nearest years...
datemin = np.datetime64(r.date[0], "Y")
datemax = np.datetime64(r.date[-1], "Y") + np.timedelta64(1, "Y")
ax.set_xlim(datemin, datemax)


# format the coords message box
def price(x):
    return "$%1.2f" % x


ax.format_xdata = mdates.DateFormatter("%Y-%m-%d")
ax.format_ydata = price
ax.grid(True)

# rotates and right aligns the x labels, and moves the bottom of the
# axes up to make room for them
fig.autofmt_xdate()

plt.show()
Total running time of the script: ( 0 minutes 0.193 seconds)