Note
Click here to download the full example code
12.3.10.1.7. Scatter 3D
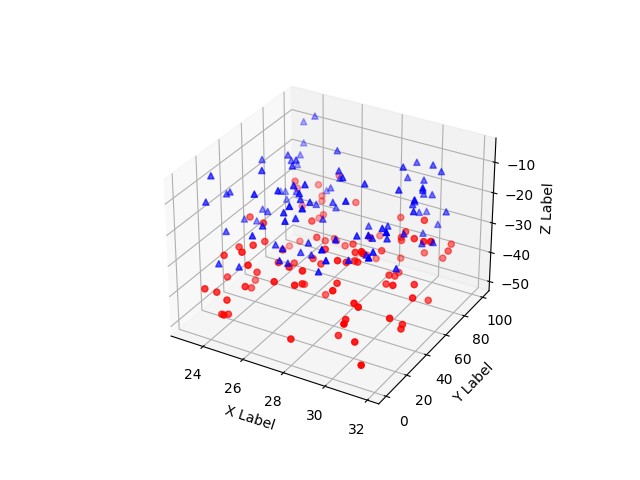
import numpy as np
import matplotlib.pyplot as plt


def randrange(n, vmin, vmax):
    return (vmax - vmin) * np.random.rand(n) + vmin


fig = plt.figure()
ax = fig.add_subplot(111, projection="3d")
n = 100
for c, m, zl, zh in [("r", "o", -50, -25), ("b", "^", -30, -5)]:
    xs = randrange(n, 23, 32)
    ys = randrange(n, 0, 100)
    zs = randrange(n, zl, zh)
    ax.scatter(xs, ys, zs, c=c, marker=m)

ax.set_xlabel("X Label")
ax.set_ylabel("Y Label")
ax.set_zlabel("Z Label")

plt.show()
Total running time of the script: ( 0 minutes 0.116 seconds)