Note
Click here to download the full example code
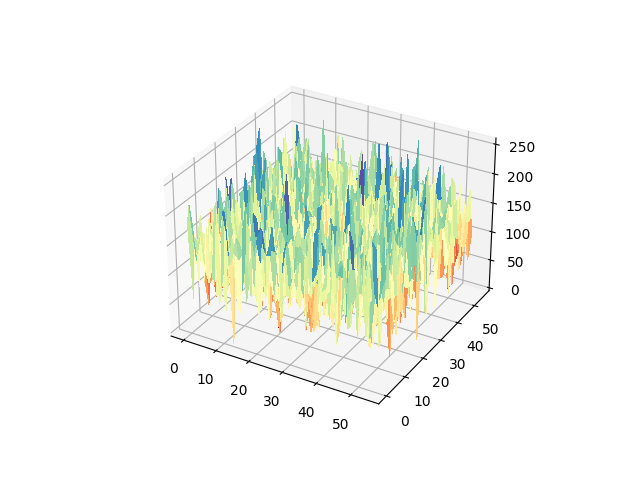
12.3.10.1.6. Surface 3D
from itom import dataObject
import matplotlib.pyplot as plt
import numpy as np


data = dataObject.randN([55, 56])
[rows, cols] = data.shape
X = np.arange(rows)
Y = np.arange(cols)
Xaxis3D, Yaxis3D = np.meshgrid(Y, X)

fig = plt.figure()
ax = fig.add_subplot(111, projection="3d")
ax.plot_surface(
    Yaxis3D,
    Xaxis3D,
    data,
    rstride=1,
    cstride=1,
    cmap=plt.cm.Spectral,
    linewidth=0,
    antialiased=False,
)
plt.show()
Total running time of the script: ( 0 minutes 0.310 seconds)