Python-Module matplotlib
The module matplotlib can be used in order to create two or three dimensional plots like in these examples:
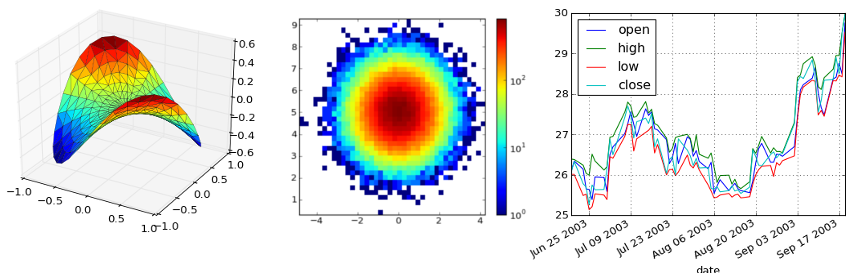
Since the internal plotting methods of itom mainly provide display widgets for plotting matrix contents and images, matplotlib can be used for plotting other types of graphics like graphs, line plots, bars... A huge list of examples can be found under http://matplotlib.org/gallery.html.
In order to render the output of matplotlib into an itom window or a user interface generated by itom (see qtcreator), you need to write the following command before importing any module of the package matplotlib:
import matplotlib
matplotlib.use('module://mpl_itom.backend_itomagg',False)
Simple Matplotlib example
This example shows you that is possible to use any arbitrary matplotlib python script and execute it in itom. Therefore, the example hist2d_log_demo.py from the pylab examples on http://matplotlib.org is taken.
Its source code is:
import matplotlib
matplotlib.use('module://mpl_itom.backend_itomagg',False)
import matplotlib.pyplot as plt
import numpy as np
from matplotlib.collections import EllipseCollection

x = np.arange(10)
y = np.arange(15)
X, Y = np.meshgrid(x, y)

XY = np.hstack((X.ravel()[:,np.newaxis], Y.ravel()[:,np.newaxis]))

ww = X/10.0
hh = Y/15.0
aa = X*9

ax = plt.subplot(1,1,1)

ec = EllipseCollection(
                        ww,
                        hh,
                        aa,
                        units='x',
                        offsets=XY,
                        transOffset=ax.transData)
ec.set_array((X+Y).ravel())
ax.add_collection(ec)
ax.autoscale_view()
ax.set_xlabel('X')
ax.set_ylabel('y')
cbar = plt.colorbar(ec)
cbar.set_label('X+Y')
title("ellipse collection")
plt.show()
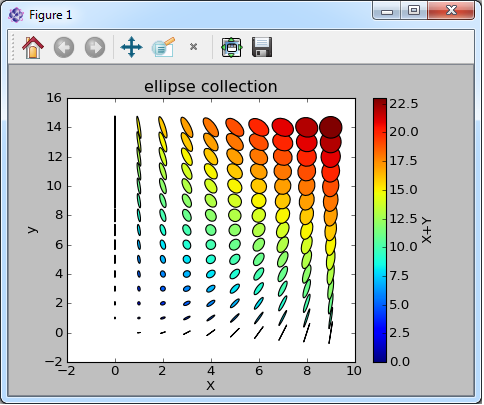
Please consider that the original source code has been changed such that the first two lines are prepended. After executing this script, the following figure is displayed in itom:
Note
If the figure does not appear, the matplotlib designer widget for itom is not available. This means, the library matplotlibFigure in the designer folder of itom is missing.
Embedding a matplotlib figure in your own user interface
itom not only provides stand-alone windows for showing the result of the matplotlib, but it is also possible to integrate a matplotlib canvas into own user interfaces created by the QtDesigner and scripted with Python. For more information how to do this, see Creating advanced dialogs and windows.
If you open the QtDesigner, you will see a widget MatplotlibFigure in the section ITOM Plugins. Then you can drag&drop one instance of this widget onto your user interface. In our case we opened a new main window and placed on the left side a MatplotlibFigure (name: mplFig) and on the right side, there are two buttons (name: btn1 and btn2):
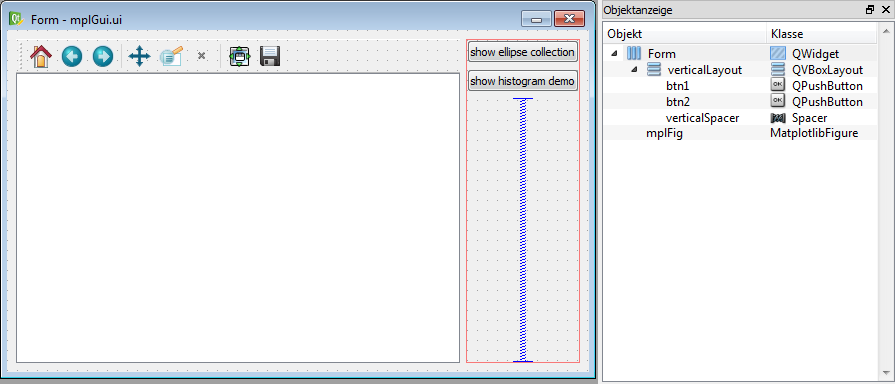
When any of the both buttons are pressed, the corresponding example should be displayed in the figure mplFig on the left side.
Rest TODO