Python-Module matplotlib
The module matplotlib can be used in order to create two or three dimensional plots like in these examples:
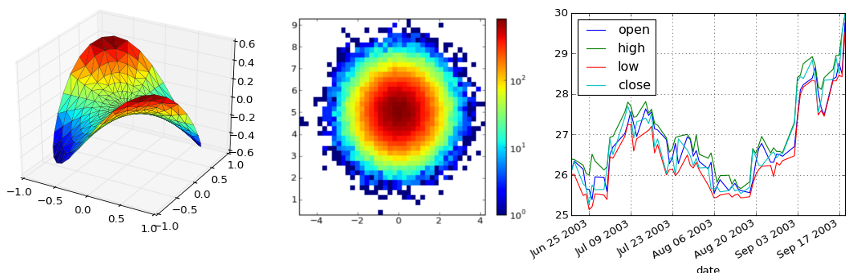
Since the internal plotting methods of itom mainly provide display widgets for plotting matrix contents and images, matplotlib can be used for plotting other types of graphics like graphs, line plots, bars... A huge list of examples can be found under http://matplotlib.org/gallery.html.
In order to render the output of matplotlib into an itom window or a user interface generated by itom (see Creating advanced dialogs and windows), you need to write the following command before importing any module of the package matplotlib:
import matplotlib
matplotlib.use('module://mpl_itom.backend_itomagg',False)
Simple Matplotlib example
This example shows you that is possible to use any arbitrary matplotlib python script and execute it in itom. Therefore, the example hist2d_log_demo.py from the pylab examples on http://matplotlib.org is taken.
Its source code is:
import matplotlib
matplotlib.use('module://mpl_itom.backend_itomagg',False)
import matplotlib.pyplot as plt
import numpy as np
from matplotlib.collections import EllipseCollection
x = np.arange(10)
y = np.arange(15)
X, Y = np.meshgrid(x, y)
XY = np.hstack((X.ravel()[:,np.newaxis], Y.ravel()[:,np.newaxis]))
ww = X/10.0
hh = Y/15.0
aa = X*9
ax = plt.subplot(1,1,1)
ec = EllipseCollection(
ww,
hh,
aa,
units='x',
offsets=XY,
transOffset=ax.transData)
ec.set_array((X+Y).ravel())
ax.add_collection(ec)
ax.autoscale_view()
ax.set_xlabel('X')
ax.set_ylabel('y')
cbar = plt.colorbar(ec)
cbar.set_label('X+Y')
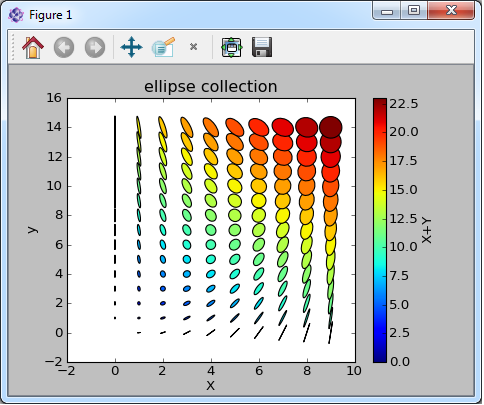
title("ellipse collection")
plt.show()
Please consider that the original source code has been changed such that the first two lines are prepended. After executing this script, the following figure is displayed in itom:
Note
If the figure does not appear, the matplotlib designer widget for itom is not available. This means, the library matplotlibPlot in the designer folder of itom is missing.
Further examples from the official matplotlib gallery are contained in the itom subfolder demo/matplotlib.
Embedding a matplotlib figure in your own user interface
itom not only provides stand-alone windows for showing the result of the matplotlib, but it is also possible to integrate a matplotlib canvas into own user interfaces created by the QtDesigner and scripted with Python. For more information how to do this, see Creating advanced dialogs and windows.
In the widget library of QtDesigner there is the widget MatplotlibPlot in the section itom Plugins (under the consumption that the corresponding designer plugin library is contained in the folder designer of the root directory of itom). Drag&Drop an instance of this widget onto your user interface.
In the following example, a new main window is created where a MatplotlibPlot widget (name: plot) is placed on the left side while two buttons (name: btnDroppedSpines and btnSine) are placed on the right side:
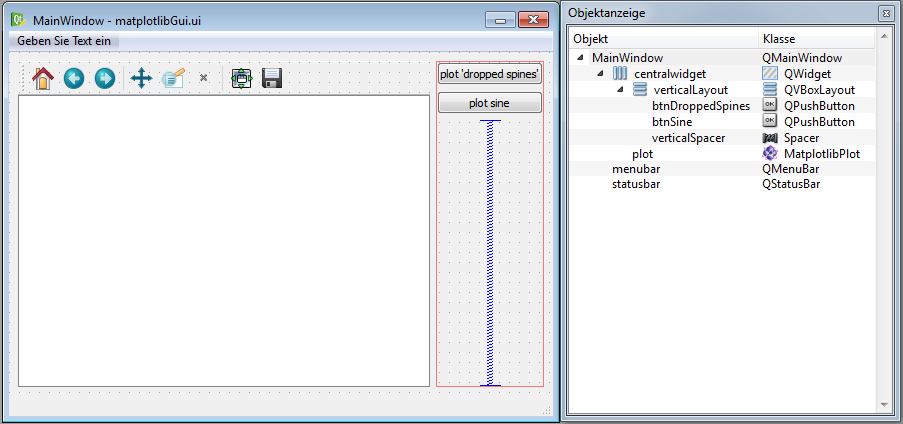
When any of the both buttons are pressed, the following example should be displayed in the figure plot on the left side.
import matplotlib
matplotlib.use('module://mpl_itom.backend_itomagg',False)
import numpy as np
import matplotlib.pyplot as plt
from mpl_toolkits.mplot3d import Axes3D

def plotDroppedSpines():
    '''
    plot taken from matplotlib example 'spines_demo_dropped.py'
    '''
    canvas = gui.plot #reference to matplotlibPlot widget
    fig = plt.figure(num = 3, canvas=canvas)
    ax = fig.add_subplot(111)
    ax.clear()

    image = np.random.uniform(size=(10, 10))
    ax.imshow(image, cmap=plt.cm.gray, interpolation='nearest')
    ax.set_title('dropped spines')

    # Move left and bottom spines outward by 10 points
    ax.spines['left'].set_position(('outward', 10))
    ax.spines['bottom'].set_position(('outward', 10))
    # Hide the right and top spines
    ax.spines['right'].set_visible(False)
    ax.spines['top'].set_visible(False)
    # Only show ticks on the left and bottom spines
    ax.yaxis.set_ticks_position('left')
    ax.xaxis.set_ticks_position('bottom')

    plt.show()


def plotSine():
    '''
    plots sine, taken from matplotlib gallery examples
    '''
    t = np.arange(0.0, 1.0, 0.01)
    s = np.sin(2*np.pi*t)

    canvas = gui.plot #reference to matplotlibPlot widget
    fig = plt.figure(num = 3, canvas=canvas)
    ax = fig.add_subplot(111)
    ax.clear()
    ax.plot(t,s)

    plt.show()

gui = ui("matplotlibGui.ui", type = ui.TYPEWINDOW)
gui.btnSine.connect("clicked()", plotSine)
gui.btnDroppedSpines.connect("clicked()", plotDroppedSpines)
gui.show()

# if you call this script for the second time, the given figure-num (3)
# is already in used for the lastly closed figure. Therefore also tell
# matplotlib to close this figure handle.
plt.close(3)
The result is:
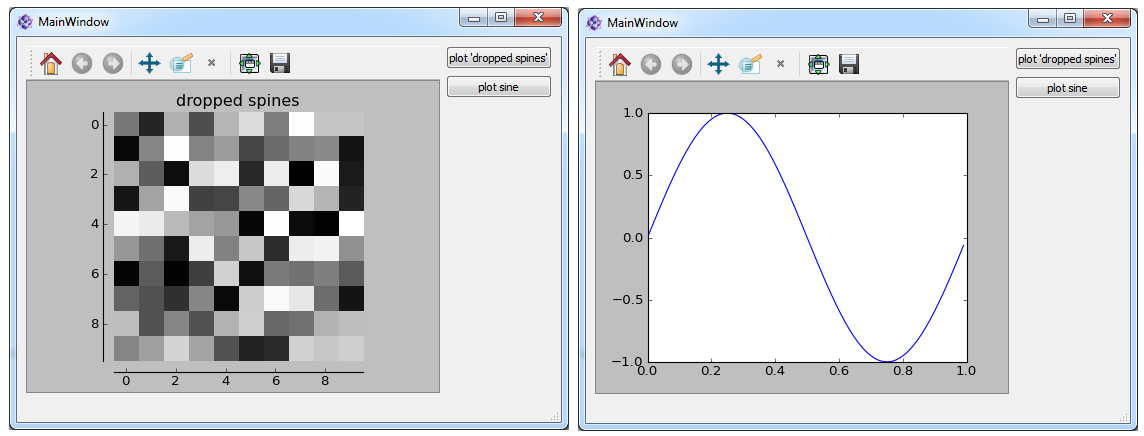
What happens here?
- At the end of the script, the user interface matplotlibGui.ui is loaded and referenced by the variable gui.
- The click-events of both buttons is connected to the methods plotSine and plotDroppedSpines respectively.
- The gui is shown
For both button clicks the following things have to be done:
Once you added the itom-backend command as first, mandatory line to your script, the figure-class of matplotlib has got one further keyword-based parameter canvas. This needs to be used in order to tell the figure where the widget is to plot the content to. If you omit this parameter, a new window is opened with the corresponding output. If you set this parameter to the reference of the widget of type MatplotlibPlot (here: called canvas), the output is print there.
The you have the reference to the figure-instance of matplotlib and can go one like usual.
Note
Once you created one figure that maps to a given widget using the canvas-keyword, this figure is not deleted when a new figure is created using the same keyword. Therefore it will happen that lots of invisible figures need to be handled. Therefore, the num keyword argument is used in the methods in the example in order to always tell matplotlib that a defined figure with the handle 3 should be instantiated. If this handle already exists, this existing figure is used. Therefore it is also necessary to clear the axes using ax.clear().
Furthermore, if you created a figure with a given num and canvas, deletes the user interface and creates a new one, a new figure with the handle of the old one is not able to plot in the new user interface since it still is connected with the old, deleted widget. Therefore, the command:
plt.close(3)
is used to firstly delete the matplotlib-figure with handle 3 once the script is re-executed.
Note
Usually, matplotlib is allowed changing the size of the output window. The window is then forced to have a new size that can afterwards be manually resized. If your output widget is embedded in an user interface, this behaviour might be undesired. Then disable it by setting the property forceWindowResize to False. In the example above this can be done by:
gui.plot["forceWindowResize"] = False
or by directlly setting the corresponding property when designing the user interface in QtDesigner.
This example is contained in the demo/ui/embeddedMatplotlib folder.