line plots (1D)
In order to plot a 1D line (1 x M or M x 1 DataObject) or multiple lines in a line plot, the designer plugin Itom1DQwtPlot is
the recommended visualization tool. You can either add this class name (itom1dqwtplot) to any plot() or liveImage()
command in order to force the data to be plotted in this plot type and / or set this plugin to be the default plot for 1D static and live plots.
The latter can be done in the property dialog or itom, tab Plots and Figures >> Default Plots. Set there the default figure plot to Itom1DQwtPlot for the categories
- DObjLiveLine
- DObjStaticLine
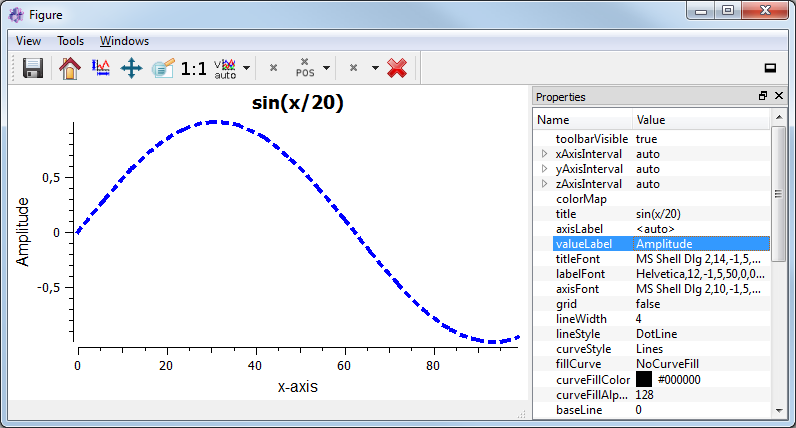
This plot has been created by the following code snippet:
import numpy as np
X = np.linspace(0,100)
Y = np.sin(X/20)
plot(Y, className = 'itom1dqwtplot', \
    properties = {"title":"sin(X/20)", "valueLabel":"Amplitude"})
If you choose itom1dqwtplot as className for the plot() command with a 2D data object as argument,
is it also possible to plot multiple lines. The plot plugin accepts all available data types, including colors and complex values.
Data is plotted as follows:
- Real data types: One or multiple lines are plotted where the horizontal axis corresponds to the grid of the data object considering possible scaling and offset values. The line(s) have different colours. The colour of one line can also be adjusted.
- Complex types: This is the same than for real data types, however you can choose whether the absolute, phase, real or imaginary part of the complex values is plotted.
- color type: Coloured data objects will be represented by either 3 or 4 lines (red, green and blue, alpha optional) that correspond to the three colour channels or by one line representing the converted gray values.
Using Python or the properties toolbox (View >> properties or via right click on the toolbar), it is possible to adjust many properties like stated below.
The plot allows value and min/max-picking via place-able marker.
The plot supports geometric element and marker interaction via drawAndPickElements(...) and call(“userInteractionStart”,...). See section Primitives - Marking and Measuring for a short introduction.
You can also use the “matplotlib”-backend to plot slices or xy-coordinates. See section Python-Module matplotlib for more information about how to use “matplotlib”.
The plot-canvas can be exported to vector and bitmap-graphics via button or menu entry or it can be exported to clipBoard via ctrl-c or a public slot.
Properties
selectedGeometry : int, get the currently selected geometric element within this plot
enablePlotting : bool, enable and disable internal plotting functions and GUI-elements for geometric elements.
keepAspectRatio : bool, enable and disable a fixed 1:1 aspect ratio between x and y axis.
geometricElementsCount : int, number of currently existing geometric elements.
geometricElements : ito::DataObject, geometric elements defined by a float32[11] array for each element.
axisFont : QFont, font for axes tick values.
labelFont : QFont, Font for axes descriptions.
titleFont : QFont, Font for title.
valueLabel : QString, Label of the value axis (y-axis) or ‘<auto>’ if the description should be used from data object.
axisLabel: QString, Label of the direction (x/y) axis or ‘<auto>’ if the descriptions from the data object should be used.
title : QString, Title of the plot or ‘<auto>’ if the title of the data object should be used.
bounds : QVector<QPointF>,
colorMap : QString, Color map (string) that should be used to colorize a non-color data object.
yAxisInterval : If member auto of autoInterval is False, the visible range of the displayed y-axis is set to the given range (in coordinates of the data object); else the range is automatically determined and set [default].
xAxisInterval : If member auto of autoInterval is False, the visible range of the displayed x-axis is set to the given range (in coordinates of the data object); else the range is automatically determined and set [default].
camera : ito::AddInDataIO, Use this property to set a camera/grabber to this plot (live image).
displayed : ito::DataObject, This returns the currently displayed data object [read only].
source : ito::DataObject, Sets the input data object for this plot.
contextMenuEnabled : bool, Defines whether the context menu of the plot should be enabled or not.
toolbarVisible : bool, Toggles the visibility of the toolbar of the plot.
Signals
plotItemsFinished(int,bool): Signal emitted if plotting of n-elements if finished. Use this for non-blocking synchronisation.
counts, int: Number of plotted elements
aborted, bool: Flag showing if draw function was cancelled during plotting
plotItemsDeleted():
Signal emitted if geometric elements were deleted.
plotItemDeleted(ito::int32):
Signal emitted if specified geometric element was deleted.
plotItemChanged(ito::int32,ito::int32,QVector<ito::float32>):
Signal emitted if specified geometric element was changed.
idx, ito::int32: Index of changed element
element, QVector<ito::float32>: New geometric featured of changed element
userInteractionDone(int,bool,QPolygonF):
Signal emitted if user interaction is done. Internal function used for blocking synchronisation.
Slots
ito::DataObject getDisplayed( ):
Retrieve currently displayed dataObject.
ito::RetVal clearGeometricElements( ):
Delete all geometric Elements
void userInteractionStart( int type, bool start [, int maxNrOfPoints = -1] ):
This slot should be called of non-blocking GUI-based drawing of geometric elements within this plot is necessary. See section Primitives - Marking and Measuring for a short introduction.
type, int: type to plot
start, bool: true if plotting should be started
maxNrOfPoints, int: number of elements to plot
ito::RetVal deleteMarkers( int id):
Delete geometric element
id, int: the 0-based index of specific geometric element
ito::RetVal plotMarkers( ito::DataObject coords, QString style [, QString id = “” [, int plane = -1]]) :
This slot is called to visualize markers and python-based plotting of geometric elements within this plot. See section Primitives - Marking and Measuring for a short introduction.
coords, ito::DataObject: an initialized dataObject with a column per element and a set of rows describing its geometric features
style, QString: Style for plotted markers, for geometric elements it is ignored
id, QString: Text based id for markers will be ignored for geometric elements.
ito::RetVal setLinePlot( double x0, double y0, double x1, double y1 [, int linePlotIdx = -1]):
this can be invoked by python to trigger a line plot, inherited from class AbstractDObjFigure
x0, double: first position of line plot in x-Direction
y0, double: first position of line plot in y-Direction
x1, double: second position of line plot in x-Direction
y1, double: second position of line plot in x-Direction
ito::RetVal setSource( ito::DataObject source, ItomSharedSemaphore* )
refreshPlot( ):
Refresh / redraw current plot
copyToClipBoard():
Copy current canvas with white background to clipBoard
Deprecated figures
The plot-dll “itom1DQWTFigure” is deprecated and has been replaced by “Itom1DQwtPlot”.