5.5. image plots (2D)
“Itom2dQwtPlot” and “GraphicViewPlot” are the basic plots for visualization of images, dataObjects or other array-like objects. Both plots have a line-cut and point picker included. By pressing “Ctrl” during picker movement, the picker can only be moved horizontal or vertical according to the mouse movement.
You can also use the “matplotlib”-backend to plot any data structures (lines, bars, statistical plots, images, contours, 3d plots...). See section Python-Module matplotlib for more information about how to use “matplotlib”.
5.5.1. Itom2dQwtPlot
“Itom2dQwtPlot” is designed for visualizing metrical data, false color or topography measurements. It supports the axis-scaling / axis offset of dataObjects, offers axis-tags and meta-data handling. All data types are accepted except the plotting of real color objects (rgba). To plot complex objects, it is possible to choose between the following modes: “absolute”, “phase”, “real” and “imaginary”. The data is plotted mathematically correct. This means the value at [0,0] is in the lower left position. This can be changed by the property yAxisFlipped.
The plot supports geometric element and marker interaction via drawAndPickElements(...) and call(“userInteractionStart”,...). See section Markers, user selections and geometric shapes for a short introduction.
Features:
- Export graphics to images, pdf, vector graphics (via button) or to the clipboard (ctrl-c).
- Metadata support (the ‘title’-tag is used as title of the plot).
- Supports fixed ratio x/y-axis but not necessary fixed ratio to monitor-pixel
- Drawing of geometrical elements and markers by script and user interaction.
- Images are displayed either mathematically ([0,0] lower left) or in windows-style ([0,0] upper left) (Property: ‘yAxisFlipped’)
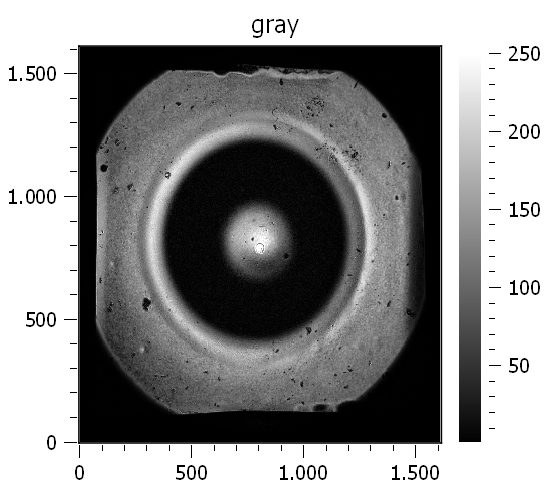
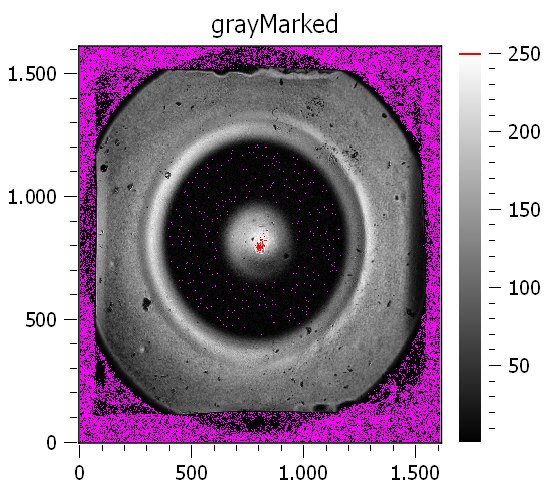
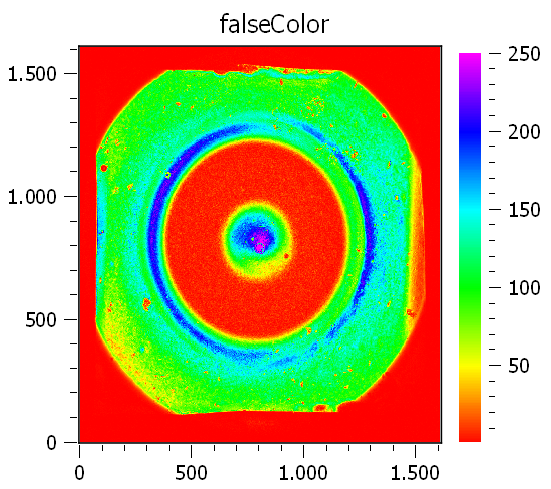
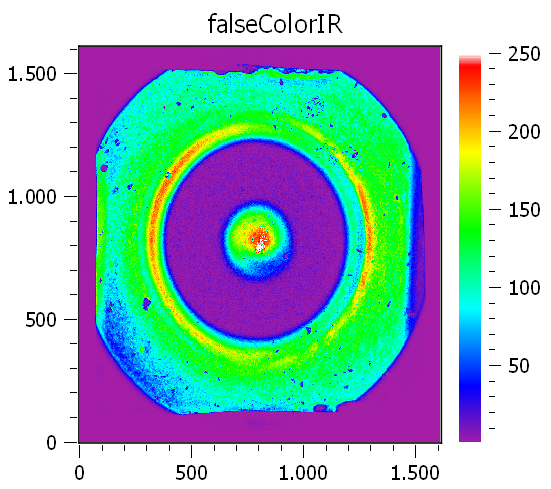
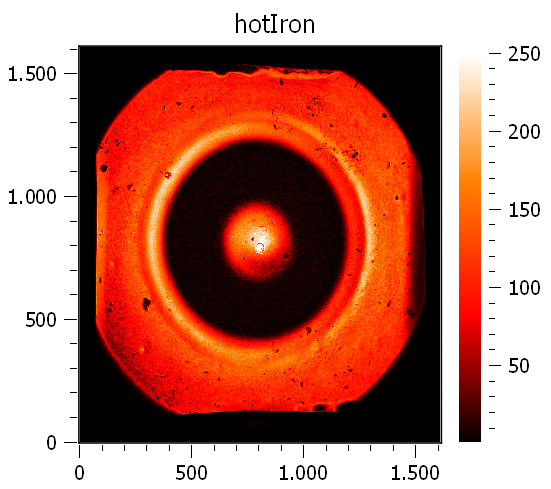
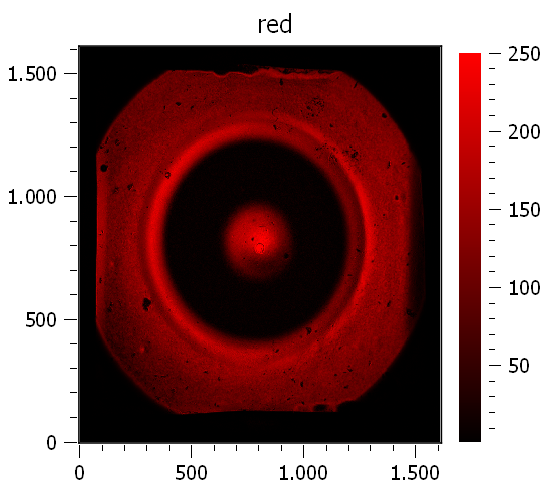
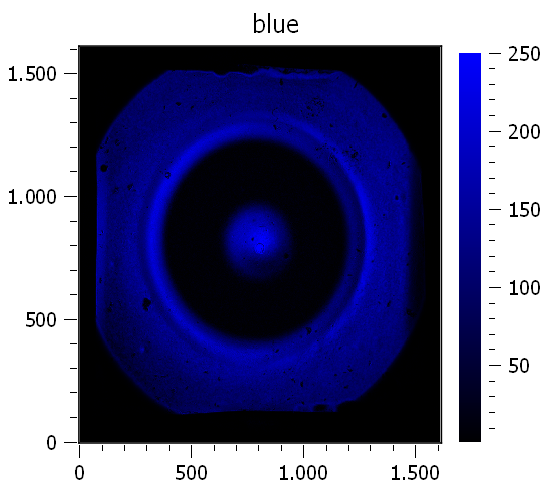
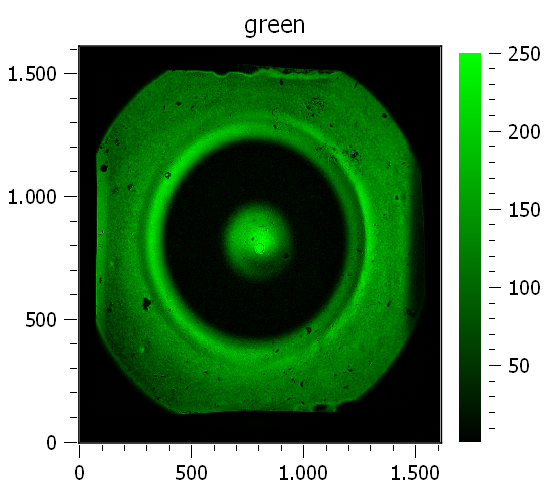
Available colorMaps:
|
|
|
|
|
|
|
|
|
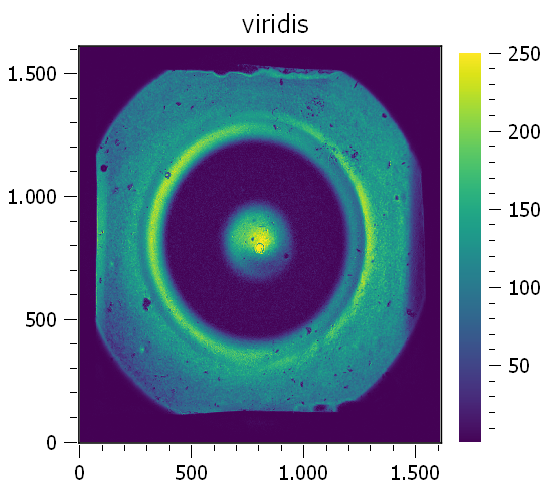
This example shows how the colorMap is set with the itom plot() command:
plot(dataObject, properties ={"colorMap" : "viridis"})
5.5.1.1. Properties
-
selectedGeometricShape : int Get or set the currently highlighted geometric shape. After manipulation the last element stays selected.
-
toolbarVisible : bool Toggles the visibility of the toolbar of the plot.
-
lineCutData : dataObject (readonly) Get the currently displayed slices from the child lineplot
-
allowedGeometricShapes : ItomQwtPlotEnums::ShapeTypes Combination of values of enumeration ShapeType to decide which types of geometric shapes are allowed (default: all shape types are allowed)
The type ‘ItomQwtPlotEnums::ShapeTypes’ is a flag mask that can be a combination of one or several of the following values (or-combination number values or semicolon separated strings):
- ‘MultiPointPick’ (1)
- ‘Point’ (2)
- ‘Line’ (4)
- ‘Rectangle’ (8)
- ‘Square’ (16)
- ‘Ellipse’ (32)
- ‘Circle’ (64)
- ‘Polygon’ (128)
-
source : dataObject Sets the input data object for this plot.
-
yAxisLabel : str Label of the y-axis or ‘<auto>’ if the description from the data object should be used.
-
backgroundColor : color str, rgba or hex Get/set the background color.
-
yAxisFlipped : bool Sets whether y-axis should be flipped (default: false, zero is at the bottom).
-
xAxisLabel : str Label of the x-axis or ‘<auto>’ if the description from the data object should be used.
-
labelFont : font Font for axes descriptions.
-
contextMenuEnabled : bool Defines whether the context menu of the plot should be enabled or not.
-
geometricShapesLabelsVisible : bool Toggle visibility of shape labels, the label is the name of the shape.
-
keepAspectRatio : bool Enable or disable a fixed 1:1 aspect ratio between x and y axis.
-
textColor : color str, rgba or hex Get/set the color of text and tick-numbers.
-
geometryModificationModes : ItomQwtPlotEnums::ModificationModes Bitmask to globally change how geometric shapes can be modified. The possible modes of a shape are both restricted by the shape’s flags and the allowed modes of the plot (move: 0x01, rotate: 0x02, resize: 0x04)
The type ‘ItomQwtPlotEnums::ModificationModes’ is a flag mask that can be a combination of one or several of the following values (or-combination number values or semicolon separated strings):
- ‘Move’ (1)
- ‘Rotate’ (2)
- ‘Resize’ (4)
-
displayed : dataObject (readonly) This returns the currently displayed data object [read only].
-
titleFont : font Font for title.
-
yAxisVisible : bool Sets visibility of the y-axis.
-
geometricShapesCount : int (readonly) Number of currently existing geometric shapes.
-
enableBoxFrame : bool If true, a 1px solid border is drawn as a boxed rectangle around the canvas, else no margin is visible on the upper and right side.
-
zSlicePlotItem : uiItem Set/get the uiItem of the current line plot respective the destination line plot for z slicing. The ‘uiItem’ can be savely cast to ‘plotItem’.
-
canvasColor : color str, rgba or hex Get/set the color of the canvas.
-
title : str Title of the plot or ‘<auto>’ if the title of the data object should be used.
-
renderLegend : bool If this property is true, the legend are included in pixelmaps renderings.
-
planeIndex : int Plane index of currently visible plane.
-
geometricShapesFillOpacitySelected : int Opacity for the selected geometric shapes with an area > 0. This value ranges from 0 (not filled) to 255 (opaque).
-
xAxisInterval : autoInterval Sets the visible range of the displayed x-axis (in coordinates of the data object). Set it to ‘auto’ if range should be automatically set [default].
-
zAxisInterval : autoInterval Sets the visible range of the displayed z-axis (in coordinates of the data object). Set it to ‘auto’ if range should be automatically set [default].
-
geometricShapes : seq. of shape Get or set the geometric shapes on the canvas, they are set as a sequence of itom.shape for each shape.
-
overlayImage : dataObject Set an overlay dataObject which is shown above the main dataObject and whose opacity (see ‘overlayAlpha’) can be controlled by a slider in the toolbar. Assign None to remove the overlay object.
-
yAxisInterval : autoInterval Sets the visible range of the displayed y-axis (in coordinates of the data object). Set it to ‘auto’ if range should be automatically set [default].
-
colorBarVisible : bool Defines whether the color bar should be visible.
-
valueScale : ItomQwtPlotEnums::ScaleEngine linear or logarithmic scale (various bases) can be chosen for the value axis (color bar). Please consider, that a logarithmic scale can only display values > 1e-100 while the lower limit for the double-logarithmic scale is 1+1e-100.
The type ‘ItomQwtPlotEnums::ScaleEngine’ is an enumeration that can have one of the following values (str or int):
- ‘Linear’ (1)
- ‘Log2’ (2)
- ‘Log10’ (10)
- ‘Log16’ (16)
- ‘LogLog2’ (1002)
- ‘LogLog10’ (1010)
- ‘LogLog16’ (1016)
-
geometricShapesFillOpacity : int Opacity for geometric shapes with an area > 0. This value ranges from 0 (not filled) to 255 (opaque).
-
axisFont : font Font for axes tick values.
-
axisColor : color str, rgba or hex Get/set the color of the axis.
-
complexStyle : ItomQwtPlotEnums::ComplexType Defines whether the real, imaginary, phase or absolute of a complex number is shown. Possible options are CmplxAbs(0), CmplxImag (1), CmplxReal (2) and CmplxArg (3).
The type ‘ItomQwtPlotEnums::ComplexType’ is an enumeration that can have one of the following values (str or int):
- ‘CmplxAbs’ (0)
- ‘CmplxImag’ (1)
- ‘CmplxReal’ (2)
- ‘CmplxArg’ (3)
-
buttonSet : ButtonStyle Get/set the button set used (normal or light color for dark themes).
The type ‘ButtonStyle’ is an enumeration that can have one of the following values (str or int):
- ‘StyleBright’ (0)
- ‘StyleDark’ (1)
-
geometricShapesDrawingEnabled : bool Enable and disable internal plotting functions and GUI-elements for geometric elements.
-
unitLabelStyle : ito::AbstractFigure::UnitLabelStyle style of the axes label (slash: ‘name / unit’, keyword-in: ‘name in unit’, square brackets: ‘name [unit]’
The type ‘ito::AbstractFigure::UnitLabelStyle’ is an enumeration that can have one of the following values (str or int):
- ‘UnitLabelSlash’ (0)
- ‘UnitLabelKeywordIn’ (1)
- ‘UnitLabelSquareBrackets’ (2)
-
overlayAlpha : int Changes the value of the overlay channel
-
camera : dataIO Use this property to set a camera/grabber to this plot (live image).
-
lineCutPlotItem : uiItem Set/get the uiItem of the current line plot respective the destination line plot for lateral slicing. The ‘uiItem’ can be savely cast to ‘plotItem’.
-
colorMap : str Defines which color map should be used [e.g. grayMarked, hotIron].
-
xAxisVisible : bool Sets visibility of the x-axis.
-
overlayColorMap : str Defines which color map should be used for the overlay channel [e.g. gray, grayMarked, falseColor, falseColorIR, hotIron, red, blue, green, viridis].
-
showCenterMarker : bool Shows or hides a marker for the center of a data object.
-
markerLabelsVisible : bool Toggle visibility of marker labels, the label is the set name of the marker.
-
valueLabel : str Label of the value axis or ‘<auto>’ if the description should be used from data object.
-
overlayInterval : autoInterval Range of the overlayInterval to scale the values
5.5.1.2. Slots
-
deleteMarkers(id) [slot] Delete all sets of markers with the given id or all markers if no or an empty id is passed.
Parameters: id (str) – name of the marker set that should be removed (optional)
-
deleteGeometricShape(idx) [slot] deletes the geometric shape with the given index.
Parameters: idx (int) – idx is the index of the shape to be removed. This is the index of the shape instance itself and must not always correspond to the index-position of the shape within the tuple of all shapes
-
replot() [slot] Force a replot which is for instance necessary if values of the displayed data object changed and you want to update the plot, too.
-
setLinePlot(x0, y0, x1, y1, destID) [slot] displays a line cut plot with the given bounds.
Parameters: - x0 (int) – x-coordinate (physical units) of the first end point of the line cut.
- y0 (int) – y-coordinate (physical units) of the first end point of the line cut.
- x1 (int) – x-coordinate (physical units) of the first end point of the line cut.
- y1 (int) – y-coordinate (physical units) of the second end point of the line cut.
- destID (int) – optional and unused
-
setGeometricShapeLabel(idx, label) [slot] Set the label of geometric shape with the index idx.
Parameters:
-
refreshPlot() [slot] Triggers an update of the current plot window.
-
userInteractionStart(type, start, maxNrOfPoints) [slot] starts or aborts the process to let the user add a certain number of geometric shapes to the canvas.
Parameters: - type (int) – type of the geometric shape the user should add (e.g. shape.Line, shape.Point, shape.Rectangle, shape.Square...
- start (bool) – True if the interaction should be started, False if a running interaction process should be aborted
- maxNrOfPoints (int) – number of shapes that should be added, the user can quit earlier by pressing Esc (optional, default: -1 -> infinite number of shapes)
-
plotMarkers(coordinates, style, id, plane) [slot] Draws sub-pixel wise markers to the canvas of the plot
Parameters: - coordinates (dataObject) – 2xN data object with the 2D coordinates of the markers (first row: X, second row: Y coordinates in axis coordinates of the plot)
- style (str) – Style string for the set of markers (e.g. ‘r+20’ for red crosses with a size of 20px)
- id (str) – Name of the set of added markers (optional, default=’‘)
- plane (int) – If the dataObject has more than 2 dimensions, it is possible to add the markers to a specific plane only (optional, default=-1 -> all planes)
-
savePlot(filename, xsize, ysize, resolution) [slot] saves the plot as image, pdf or svg file (the supported file formats are listed in the save dialog of the plot)
Parameters: - filename (str) – absolute or relative filename whose suffix defines the file format
- xsize (float) – x-size of the canvas in mm. If 0.0 [default], the size of the canvas is determined by the current size of the figure
- ysize (float) – y-size of the canvas in mm. If 0.0 [default], the size of the canvas is determined by the current size of the figure
- resolution (int) – resolution of image components in the plot in dpi (default: 300dpi)
-
setGeometricShapes(geometricShapes) [slot] This slot is the same than assigning a sequence of shape to the property ‘geometricShapes’. It replaces all existing shapes by the new set of shapes.
Parameters: geometricShapes (seq. of shapes) – Sequence (e.g tuple or list) of shapes that replace all existing shapes by this new set.
-
removeOverlayImage() [slot] removes an overlay image. This is the same than assigning ‘None’ to the property ‘overlayImage’
-
setGeometricShapeLabelVisible(idx, visible) [slot] Set the visibility of the label of a geometric shape with the given index.
Parameters:
-
getPlotID() [slot] Return window ID of this plot {int}.
-
getDisplayedLineCut() [slot] returns the currently displayed line cut dataObject
-
getDisplayed() [slot] returns the currently displayed dataObject.
-
renderToPixMap(xsize, ysize, resolution) [slot] returns a QPixmap with the content of the plot
Parameters:
-
copyToClipBoard() [slot] copies the entire plot to the clipboard as bitmap data.
-
addGeometricShape(geometricShape) [slot] Add a new geometric shape to the canvas if no shape with the same index already exists.
If the index of the new shape is -1 (default), the next free auto-incremented index will be set for this shape. (C++ only: this new index ist stored in the optional ‘newIndex’ parameter).
Parameters: geometricShape (shape) – new geometric shape Raises: RuntimeError – if the index of the shape is != -1 and does already exist
-
clearGeometricShapes() [slot] removes all geometric shapes from the canvas.
-
updateGeometricShape(geometricShape) [slot] Updates an existing geometric shape by the new shape if the index of the shape already exists, else add the new shape to the canvas (similar to ‘addGeometricShape’.
If the index of the new shape is -1 (default), the next free auto-incremented index will be set for this shape. (C++ only: this new index ist stored in the optional ‘newIndex’ parameter).
Parameters: geometricShape (shape) – new geometric shape
5.5.1.3. Signals
-
geometricShapeChanged(idx, shape) [signal] This signal is emitted whenever a geometric shape has been changed (e.g. its position or form has been changed)
Parameters: Note
To connect to this signal use the following signature:
yourItem.connect('geometricShapeChanged(int,ito::Shape)', yourMethod)
-
geometricShapeCurrentChanged(currentShape) [signal] This signal is emitted whenever the currently selected geometric has been changed
Parameters: currentShape (shape) – new current shape or an invalid shape if the current shape has been deleted and no other shape is selected now Note
To connect to this signal use the following signature:
yourItem.connect('geometricShapeCurrentChanged(ito::Shape)', yourMethod)
-
geometricShapeDeleted(idx) [signal] This signal is emitted whenever a geometric shape has been deleted
Parameters: idx (int) – index of the deleted shape Note
To connect to this signal use the following signature:
yourItem.connect('geometricShapeDeleted(int)', yourMethod)
-
geometricShapeStartUserInput(type, userInteractionReason) [signal] This signal is emitted whenever the plot enters a mode where the user can add a new geometric shape using the mouse
Parameters: - type (int) – Type of the shape that could be added by the user, this is one of the constants shape.Circle, shape.Ellipse, shape.Line...
- userInteractionReason (bool) – True if the process to add a new shape has been initialized by a script-base call, False if it has been started by a button in the toolbar or menu of the plot
Note
To connect to this signal use the following signature:
yourItem.connect('geometricShapeStartUserInput(int,bool)', yourMethod)
-
geometricShapesDeleted() [signal] This signal is emitted when the last geometric shape has been deleted or removed.
Note
To connect to this signal use the following signature:
yourItem.connect('geometricShapesDeleted()', yourMethod)
-
userInteractionDone(type, aborted, shapes) [signal] This signal is emitted if the user finished adding the requested number of shapes or aborted the process by pressing the Esc key
This signal is only emitted if the user interaction has been started by the slot userInteractionStart or by plotItem.drawAndPickElements.
Parameters: - type (int) – type of the shapes that have been recently added (e.g. shape.Line, shape.Point, shape.Rectangle, ...)
- aborted (bool) – True if the user aborted the process by pressing the Esc key before having added the total number of requested shapesshapes : {list of shape} list of shapes that have been added.
Note
To connect to this signal use the following signature:
yourItem.connect('userInteractionDone(int,bool,QVector<ito::Shape>)', yourMethod)
-
geometricShapeAdded(idx, shape) [signal] This signal is emitted whenever a geometric shape has been added
Parameters: Note
To connect to this signal use the following signature:
yourItem.connect('geometricShapeAdded(int,ito::Shape)', yourMethod)
-
planeIndexChanged(planeIndex) [signal] This signal is emitted whenever the displayed plane in a 3D dataObject is changed
Parameters: plane (int) – index of the displayed plane in the dataObject Note
To connect to this signal use the following signature:
yourItem.connect('planeIndexChanged(int)', yourMethod)
-
geometricShapeFinished(shapes, aborted) [signal] This signal is emitted whenever one or multiple geometric shapes have been added, removed or modified
Parameters: - shapes (tuple of shape) – A tuple containing all shapes that have been modified
- aborted (bool) – True if the modification process has been aborted, else False
Note
To connect to this signal use the following signature:
yourItem.connect('geometricShapeFinished(QVector<ito::Shape>,bool)', yourMethod)
5.5.2. Deprecated figures
The plot-dll “itom2DQWTFigure” and “itom2DGVFigure” are deprecated and have been replaced by “Itom2dQwtPlot” and “GraphicViewPlot”.