5.4. line plots (1D)
5.4.1. Plot of an N x M dataObject
In order to plot a 1D line (1 x M or M x 1 DataObject) or multiple lines in a line plot, the designer plugin Itom1DQwtPlot is
the recommended visualization tool. You can either use the plot1() command or add this class name (itom1dqwtplot) to any plot() or liveImage() command in order to force the data to be plotted in this plot type. Alternatively set this plugin to be the default plot for 1D static and live plots.
The latter can be done in the property dialog or itom, tab Plots and Figures >> Default Plots. Set there the default figure plot to Itom1DQwtPlot for the categories
DObjLiveLine (live 1D visualization of a dataObject)
DObjStaticLine (static 1D visualization of a dataObject)
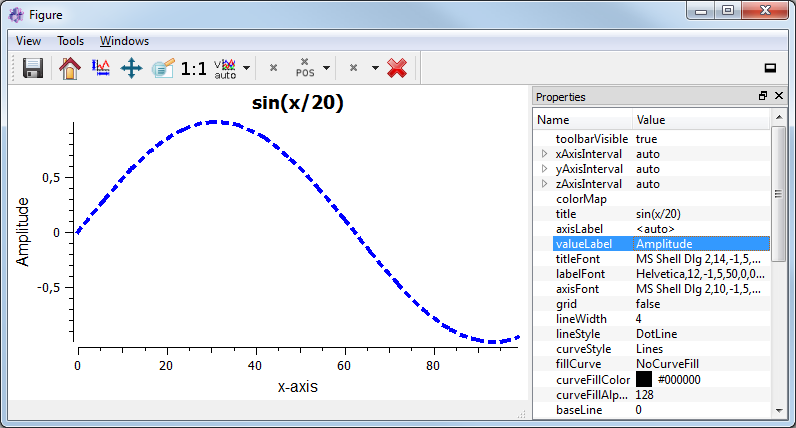
This plot has been created by the following code snippet:
import numpy as np
X = np.linspace(0,100)
Y = np.sin(X/20)
plot(Y, className = 'itom1dqwtplot', \
    properties = {"title":"sin(X/20)", "valueLabel":"Amplitude"})
5.4.2. Plot of an N x M dataObject with 1 x M x-vector
It is also possible to set an optional x-vector to the plot. This can only be done by giving a second argument to the plot1() function or by setting the property xData to an existing plot.
To plot an N x M dataObject, the x-vector has to be a 1 x M dataObject.
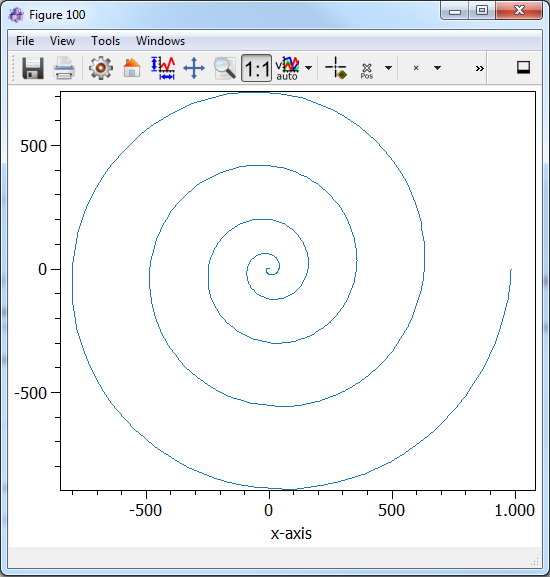
This spiral plot has been created by the demo itom/demo/plots/plotXY.py. The three methods to create such a plot are listed here:
# method 1
plot(yDataObject, xVector)

# method 2
fig = plot(yDataObject)
fig[-1]['xData'] = xVector

# method 3
plot(yDataObject, properties = {'xData', xVector})
5.4.3. Itom1dQwtPlot
If you call plot1() or choose itom1dqwtplot as className for the plot() command with a 2D data object as argument,
is it also possible to plot multiple lines. The plot plugin accepts all available data types, including colors and complex values.
Data is plotted as follows:
Real data types: One or multiple lines are plotted where the horizontal axis corresponds to the grid of the data object considering possible scaling and offset values. The line(s) have different colours. The colour of one line can also be adjusted.
Complex types: This is the same than for real data types, however you can choose whether the absolute, phase, real or imaginary part of the complex values is plotted.
color type: Coloured data objects will be represented by either 3 or 4 lines (red, green and blue, alpha optional) that correspond to the three colour channels or by one line representing the converted gray values.
Using Python or the properties toolbox (View >> properties or via right click on the toolbar), it is possible to adjust many properties like stated in the section Properties below.
The plot allows value and min/max-picking via place-able marker.
The plot supports geometric element and marker interaction via drawAndPickElements(…) and call(“userInteractionStart”,…). See section Markers, user selections and geometric shapes for a short introduction.
Calling the plot1() you can pass also an optional x-vector to plot a xy data set.
You can also use the “matplotlib”-backend to plot slices or xy-coordinates. See section Python-Module matplotlib for more information about how to use “matplotlib”.
The plot-canvas can be exported to vector and bitmap-graphics via button or menu entry or it can be exported to clipBoard via ctrl-c or a public slot.
5.4.3.1. Setting properties
If you want to modify the lines, ploted in the Plot of an N x M dataObject with 1 x M x-vector, individually you can do this with the help of Python or the curve properties widget (View >> curve properties or via right click on the toolbar). The following line properties are acessable via Python:
visible
lineStyle
lineWidth
lineColor
lineJoinStyle
lineCapStyle
lineSymbolSize
lineSymbolStyle
legendVisible
A propertie of a line can be acessed as followed:
plotHandle.call("setCurveProperty", index, property, value)
with the index (int) of the curve, the name of the property (str) and the value (various) the property will be set to. For a detailed description of the properties read the section below. In the file itom/demo/plots/demoPlot1DLineProperties.py
a short demonstration of how to set the properties is given.
For acessing the propties via the user interface the line properties widget can be used. Additional to the properties listed above the legend name, the legend visibility and the symbol color can be set.
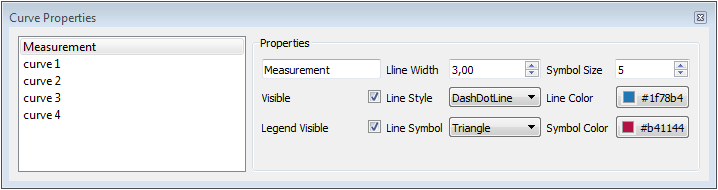
This shows the curve Properties widget.
If you want to set a propertie global for all curves you can also use the properties widget (View >> properties or via right click on the toolbar)
5.4.3.2. Legend title of line plots
Legendtitles of a line plot can be activated and modified by the curve properties or by the plot properties. Per default the legendtitles are defined as curve 0, curve 1,… If the dataObject which is plotted has defined tags named legendTitle0, legendTitle1, …, then the tag entries are used as legendTitles.
Note
An example is located in the demo script folder of itom.
5.4.3.3. Properties
-
legendLabelWidth : int Defines the width of a legend label. This can be used to create a longer line in legend entries. The minimal size is 10
-
antiAliased : bool True, if all curves should be plot with an anti-aliased render mode (slower) or False if not (faster).
-
xData : dataObject DataObject representing the xData of the plot. Expect a two dimensional dataObject with a (n x m) or (1 x m) shape for an (n x m) source object with n < m. For n > m a shape of (n x 1) or (n x m) is exspected.
-
axisScale : ItomQwtPlotEnums::ScaleEngine linear or logarithmic scale (various bases) can be chosen for the horizontal axis (x-axis). Please consider, that a logarithmic scale can only display values > 1e-100.
The type ‘ItomQwtPlotEnums::ScaleEngine’ is an enumeration that can have one of the following values (str or int):
‘Linear’ (1)
‘Log2’ (2)
‘Log10’ (10)
‘Log16’ (16)
‘LogLog2’ (1002)
‘LogLog10’ (1010)
‘LogLog16’ (1016)
-
valueScale : ItomQwtPlotEnums::ScaleEngine linear or logarithmic scale (various bases) can be chosen for the vertical axis (y-axis). Please consider, that a logarithmic scale can only display values > 1e-100 while the lower limit for the double-logarithmic scale is 1+1e-100.
The type ‘ItomQwtPlotEnums::ScaleEngine’ is an enumeration that can have one of the following values (str or int):
‘Linear’ (1)
‘Log2’ (2)
‘Log10’ (10)
‘Log16’ (16)
‘LogLog2’ (1002)
‘LogLog10’ (1010)
‘LogLog16’ (1016)
-
pickerLabelAlignment : Qt::Alignment Get / set label alignment for the picker labels.
The type ‘Qt::Alignment’ is a flag mask that can be a combination of one or several of the following values (or-combination number values or semicolon separated strings):
‘AlignLeft’ (1)
‘AlignLeading’ (1)
‘AlignRight’ (2)
‘AlignTrailing’ (2)
‘AlignHCenter’ (4)
‘AlignJustify’ (8)
‘AlignAbsolute’ (16)
‘AlignHorizontal_Mask’ (31)
‘AlignTop’ (32)
‘AlignBottom’ (64)
‘AlignVCenter’ (128)
‘AlignBaseline’ (256)
‘AlignVertical_Mask’ (480)
‘AlignCenter’ (132)
-
pickerLabelOrientation : Qt::Orientation Get / set the label orientation for the picker labels.
The type ‘Qt::Orientation’ is an enumeration that can have one of the following values (str or int):
‘Horizontal’ (1)
‘Vertical’ (2)
-
pickerLabelVisible : bool Enable and disable the labels next to each picker.
-
picker : dataObject (readonly) Get picker defined by a Mx4 float32 data object. Each row represents one picker and contains the following information: [pixelIndex, physIndex, value, curveIndex]. PixelIndex and physIndex are equal if axisScale = 1 and axisOffset = 0 for the corresponding dataObject.
-
currentPickerIndex : int Get / set currently active picker.
-
pickerCount : int (readonly) Number of picker within the plot.
-
pickerLimit : int Define the maximal number of picker for this plot.
-
pickerType : ItomQwtPlotEnums::PlotPickerType Get / set the current picker type (‘DefaultMarker’, ‘RangeMarker’, ‘ValueRangeMarker’, ‘AxisRangeMarker’)
The type ‘ItomQwtPlotEnums::PlotPickerType’ is an enumeration that can have one of the following values (str or int):
‘DefaultMarker’ (0)
‘RangeMarker’ (1)
‘ValueRangeMarker’ (2)
‘AxisRangeMarker’ (3)
-
columnInterpretation : ItomQwtPlotEnums::MultiLineMode Define the interpretation of M x N objects as Auto, FirstRow, FirstCol, MultiRows, MultiCols.
The type ‘ItomQwtPlotEnums::MultiLineMode’ is an enumeration that can have one of the following values (str or int):
‘AutoRowCol’ (0)
‘FirstRow’ (1)
‘FirstCol’ (2)
‘MultiRows’ (3)
‘MultiCols’ (4)
‘MultiLayerAuto’ (5)
‘MultiLayerCols’ (6)
‘MultiLayerRows’ (7)
-
grid : GridStyle Style of the grid (‘GridNo’, ‘GridMajorXY’, ‘GridMajorX’, ‘GridMajorY’, ‘GridMinorXY’, ‘GridMinorX’, ‘GridMinorY’).
The type ‘GridStyle’ is an enumeration that can have one of the following values (str or int):
‘GridNo’ (0)
‘GridMajorXY’ (1)
‘GridMajorX’ (2)
‘GridMajorY’ (3)
‘GridMinorXY’ (4)
‘GridMinorX’ (5)
‘GridMinorY’ (6)
-
lineSymbolSize : int Get / Set the current line symbol size
-
lineSymbol : Symbol Get / Set the current line symbol type
The type ‘Symbol’ is an enumeration that can have one of the following values (str or int):
‘NoSymbol’ (0)
‘Ellipse’ (1)
‘Rect’ (2)
‘Diamond’ (3)
‘Triangle’ (4)
‘DTriangle’ (5)
‘UTriangle’ (6)
‘LTriangle’ (7)
‘RTriangle’ (8)
‘Cross’ (9)
‘XCross’ (10)
‘HLine’ (11)
‘VLine’ (12)
‘Star1’ (13)
‘Star2’ (14)
‘Hexagon’ (15)
-
baseLine : float If curveStyle is set to ‘Sticks’, ‘SticksVertical’ or ‘SticksHorizontal’, the baseline indicates the start point of each line either in vertical or horizontal direction. For all other curve types, the baseline is considered if fillCurve is set to ‘FillBaseLine’.
-
curveFillAlpha : int set the alpha value for the curve fill color seperatly.
-
curveFillColor : color str, rgba or hex the fill color for the curve, invalid color leads to line color selection.
-
fillCurve : ItomQwtPlotEnums::FillCurveStyle fill curve below / above or according to baseline.
The type ‘ItomQwtPlotEnums::FillCurveStyle’ is an enumeration that can have one of the following values (str or int):
‘NoCurveFill’ (-1)
‘FillBaseLine’ (0)
‘FillFromTop’ (1)
‘FillFromBottom’ (2)
-
curveStyle : ItomQwtPlotEnums::CurveStyle set the style of the qwt-plot according to curve styles.
The type ‘ItomQwtPlotEnums::CurveStyle’ is an enumeration that can have one of the following values (str or int):
‘NoCurve’ (-1)
‘Lines’ (0)
‘FittedLines’ (1)
‘Sticks’ (2)
‘SticksHorizontal’ (3)
‘SticksVertical’ (4)
‘Steps’ (5)
‘StepsRight’ (6)
‘StepsLeft’ (7)
‘Dots’ (8)
-
lineStyle : Qt::PenStyle style of all lines.
The type ‘Qt::PenStyle’ is an enumeration that can have one of the following values (str or int):
‘NoPen’ (0)
‘SolidLine’ (1)
‘DashLine’ (2)
‘DotLine’ (3)
‘DashDotLine’ (4)
‘DashDotDotLine’ (5)
‘CustomDashLine’ (6)
-
lineWidth : float width of all curves in pixel.
-
legendTitles : seq. of str Seq. of strings with the legend titles for all curves. If no legends are given, the dataObject is checked for tags named ‘legendTitle0’, ‘legendTitle1’… If these tags are not given, the default titles ‘curve 0’, ‘curve 1’… are taken.
-
legendPosition : LegendPos Position of the legend (Off, Left, Top, Right, Bottom)
The type ‘LegendPos’ is an enumeration that can have one of the following values (str or int):
‘Off’ (0)
‘Left’ (1)
‘Top’ (2)
‘Right’ (3)
‘Bottom’ (4)
-
legendFont : font Font for legend entries
-
labelFont : font Font for axes descriptions.
-
axisFont : font Font for axes tick values.
-
titleFont : font Font for title.
-
valueLabel : str Label of the value axis (y-axis) or ‘<auto>’ if the description should be used from data object.
-
axisLabel : str Label of the direction (x/y) axis or ‘<auto>’ if the descriptions from the data object should be used.
-
title : str Title of the plot or ‘<auto>’ if the title of the data object should be used.
-
bounds :
-
complexStyle : ItomQwtPlotEnums::ComplexType Defines whether the real, imaginary, phase or absolute of a complex number is shown. Possible options are CmplxAbs(0), CmplxImag (1), CmplxReal (2) and CmplxArg (3).
The type ‘ItomQwtPlotEnums::ComplexType’ is an enumeration that can have one of the following values (str or int):
‘CmplxAbs’ (0)
‘CmplxImag’ (1)
‘CmplxReal’ (2)
‘CmplxArg’ (3)
-
markerLabelsVisible : bool Toggle visibility of marker labels, the label is the set name of the marker.
-
unitLabelStyle : ito::AbstractFigure::UnitLabelStyle style of the axes label (slash: ‘name / unit’, keyword-in: ‘name in unit’, square brackets: ‘name [unit]’
The type ‘ito::AbstractFigure::UnitLabelStyle’ is an enumeration that can have one of the following values (str or int):
‘UnitLabelSlash’ (0)
‘UnitLabelKeywordIn’ (1)
‘UnitLabelSquareBrackets’ (2)
-
geometricShapesLabelsVisible : bool Toggle visibility of shape labels, the label is the name of the shape.
-
geometricShapesFillOpacitySelected : int Opacity for the selected geometric shapes with an area > 0. This value ranges from 0 (not filled) to 255 (opaque).
-
geometricShapesFillOpacity : int Opacity for geometric shapes with an area > 0. This value ranges from 0 (not filled) to 255 (opaque).
-
allowedGeometricShapes : ItomQwtPlotEnums::ShapeTypes Combination of values of enumeration ShapeType to decide which types of geometric shapes are allowed (default: all shape types are allowed)
The type ‘ItomQwtPlotEnums::ShapeTypes’ is a flag mask that can be a combination of one or several of the following values (or-combination number values or semicolon separated strings):
‘MultiPointPick’ (1)
‘Point’ (2)
‘Line’ (4)
‘Rectangle’ (8)
‘Square’ (16)
‘Ellipse’ (32)
‘Circle’ (64)
‘Polygon’ (128)
-
geometryModificationModes : ItomQwtPlotEnums::ModificationModes Bitmask to globally change how geometric shapes can be modified. The possible modes of a shape are both restricted by the shape’s flags and the allowed modes of the plot (move: 0x01, rotate: 0x02, resize: 0x04)
The type ‘ItomQwtPlotEnums::ModificationModes’ is a flag mask that can be a combination of one or several of the following values (or-combination number values or semicolon separated strings):
‘Move’ (1)
‘Rotate’ (2)
‘Resize’ (4)
-
geometricShapesDrawingEnabled : bool Enable and disable internal plotting functions and GUI-elements for geometric elements.
-
selectedGeometricShape : int Get or set the currently highlighted geometric shape. After manipulation the last element stays selected.
-
geometricShapesCount : int (readonly) Number of currently existing geometric shapes.
-
geometricShapes : seq. of shape Get or set the geometric shapes on the canvas, they are set as a sequence of itom.shape for each shape.
-
keepAspectRatio : bool Enable or disable a fixed 1:1 aspect ratio between x and y axis.
-
backgroundColor : color str, rgba or hex Get/set the background color.
-
canvasColor : color str, rgba or hex Get/set the color of the canvas.
-
textColor : color str, rgba or hex Get/set the color of text and tick-numbers.
-
axisColor : color str, rgba or hex Get/set the color of the axis.
-
buttonSet : ButtonStyle Get/set the button set used (normal or light color for dark themes).
The type ‘ButtonStyle’ is an enumeration that can have one of the following values (str or int):
‘StyleBright’ (0)
‘StyleDark’ (1)
-
enableBoxFrame : bool If true, a 1px solid border is drawn as a boxed rectangle around the canvas, else no margin is visible on the upper and right side.
-
colorMap : str Color map (string) that should be used to colorize a non-color data object.
-
zAxisInterval : autoInterval Sets the visible range of the displayed z-axis (in coordinates of the data object). Set it to ‘auto’ if range should be automatically set [default].
-
yAxisInterval : autoInterval Sets the visible range of the displayed y-axis (in coordinates of the data object). Set it to ‘auto’ if range should be automatically set [default].
-
xAxisInterval : autoInterval Sets the visible range of the displayed x-axis (in coordinates of the data object). Set it to ‘auto’ if range should be automatically set [default].
-
camera : dataIO Use this property to set a camera/grabber to this plot (live image).
-
displayed : dataObject (readonly) This returns the currently displayed data object [read only].
-
source : dataObject Sets the input data object for this plot.
-
renderLegend : bool If this property is true, the legend are included in pixelmaps renderings.
-
contextMenuEnabled : bool Defines whether the context menu of the plot should be enabled or not.
-
toolbarVisible : bool Toggles the visibility of the toolbar of the plot.
5.4.3.4. Slots
-
getDisplayed() [slot] returns the currently displayed dataObject.
-
showCurveProperties() [slot]
-
getCurveProperty(index, property) [slot] Get a property of a specific curve
Get the value of a property of a specific curve (see slot ‘setCurveProperty’).
-
setCurveProperty(index, property, value) [slot] Set a property of a specific curve
Some curve properties can be changed globally for all curves using the global properties. However, it is also possible to set a property to different values for each curve.
-
deletePicker(id) [slot] Delete the i-th picker (id >= 0) or all pickers (id = -1)
- Parameters
id (int) – zero-based index of the picker to be deleted, or -1 if all pickers should be deleted (default). This parameter is optional.
-
appendPicker(coordinates, curveIndex, physicalCoordinates) [slot] Append plot pickers to a specific curve either in physical (axis) or in pixel coordinates.
The pixel coordinates are the pixels of the currently displayed dataObject. The coordinates are the axis positions only, the values are chosen from the curve values. Existing pickers are not removed before this operation.
- Parameters
coordinates (seq. of float) – x-coordinates of each picker, the y-coordinate is automatically chosen from the shape of the curve. If the size of the sequence plus the number of existing pickers exceed the ‘pickerLimit’, a RuntimeError is thrown.curveIndex : {int} index of the curve where the pickers should be attached to (optional, default: 0 - first curve)
physicalCoordinates (bool) – optional, if True (default), ‘coordinates’ are given in axis coordinates of the plot (hence, physical coordinates of the dataObject; False: ‘coordinates’ are given in pixel coordinates of the dataObject
-
setPicker(coordinates, curveIndex, physicalCoordinates) [slot] Set plot pickers to a specific curve either in physical (axis) or in pixel coordinates.
The pixel coordinates are the pixels of the currently displayed dataObject. The coordinates are the axis positions only, the values are chosen from the curve values. Existing pickers are deleted at first.
- Parameters
coordinates (seq. of float) – x-coordinates of each picker, the y-coordinate is automatically chosen from the shape of the curve. If the size of the sequence exceeds the ‘pickerLimit’, a RuntimeError is thrown.curveIndex : {int} index of the curve where the pickers should be attached to (optional, default: 0 - first curve)
physicalCoordinates (bool) – optional, if True (default), ‘coordinates’ are given in axis coordinates of the plot (hence, physical coordinates of the dataObject; False: ‘coordinates’ are given in pixel coordinates of the dataObject
-
setLegendTitles(legends) [slot]
-
replot() [slot] Force a replot which is for instance necessary if values of the displayed data object changed and you want to update the plot, too.
-
deleteMarkers(id) [slot] Delete all sets of markers with the given id or all markers if no or an empty id is passed.
- Parameters
id (str) – name of the marker set that should be removed (optional)
-
plotMarkers(coordinates, style, id, plane) [slot] Draws sub-pixel wise markers to the canvas of the plot
- Parameters
coordinates (dataObject) – 2xN data object with the 2D coordinates of the markers (first row: X, second row: Y coordinates in axis coordinates of the plot)
style (str) – Style string for the set of markers (e.g. ‘r+20’ for red crosses with a size of 20px)
id (str) – Name of the set of added markers (optional, default=’’)
plane (int) – If the dataObject has more than 2 dimensions, it is possible to add the markers to a specific plane only (optional, default=-1 -> all planes)
-
setGeometricShapeLabelVisible(idx, visible) [slot] Set the visibility of the label of a geometric shape with the given index.
-
setGeometricShapeLabel(idx, label) [slot] Set the label of geometric shape with the index idx.
-
updateGeometricShape(geometricShape) [slot] Updates an existing geometric shape by the new shape if the index of the shape already exists, else add the new shape to the canvas (similar to ‘addGeometricShape’.
If the index of the new shape is -1 (default), the next free auto-incremented index will be set for this shape. (C++ only: this new index ist stored in the optional ‘newIndex’ parameter).
- Parameters
geometricShape (shape) – new geometric shape
-
addGeometricShape(geometricShape) [slot] Add a new geometric shape to the canvas if no shape with the same index already exists.
If the index of the new shape is -1 (default), the next free auto-incremented index will be set for this shape. (C++ only: this new index ist stored in the optional ‘newIndex’ parameter).
- Parameters
geometricShape (shape) – new geometric shape
- Raises
RuntimeError – if the index of the shape is != -1 and does already exist
-
setGeometricShapes(geometricShapes) [slot] This slot is the same than assigning a sequence of shape to the property ‘geometricShapes’. It replaces all existing shapes by the new set of shapes.
- Parameters
geometricShapes (seq. of shapes) – Sequence (e.g tuple or list) of shapes that replace all existing shapes by this new set.
-
deleteGeometricShape(idx) [slot] deletes the geometric shape with the given index.
- Parameters
idx (int) – idx is the index of the shape to be removed. This is the index of the shape instance itself and must not always correspond to the index-position of the shape within the tuple of all shapes
-
clearGeometricShapes() [slot] removes all geometric shapes from the canvas.
-
userInteractionStart(type, start, maxNrOfPoints) [slot] starts or aborts the process to let the user add a certain number of geometric shapes to the canvas.
- Parameters
type (int) – type of the geometric shape the user should add (e.g. shape.Line, shape.Point, shape.Rectangle, shape.Square…
start (bool) – True if the interaction should be started, False if a running interaction process should be aborted
maxNrOfPoints (int) – number of shapes that should be added, the user can quit earlier by pressing Esc (optional, default: -1 -> infinite number of shapes)
-
renderToPixMap(xsize, ysize, resolution) [slot] returns a QPixmap with the content of the plot
-
savePlot(filename, xsize, ysize, resolution) [slot] saves the plot as image, pdf or svg file (the supported file formats are listed in the save dialog of the plot)
- Parameters
filename (str) – absolute or relative filename whose suffix defines the file format
xsize (float) – x-size of the canvas in mm. If 0.0 [default], the size of the canvas is determined by the current size of the figure
ysize (float) – y-size of the canvas in mm. If 0.0 [default], the size of the canvas is determined by the current size of the figure
resolution (int) – resolution of image components in the plot in dpi (default: 300dpi)
-
copyToClipBoard() [slot] copies the entire plot to the clipboard as bitmap data (uses the default export resolution).
-
setLinePlot(x0, y0, x1, y1, destID) [slot] This slot can be implemented by any plot plugin to force the plot to open a line plot. Here it is not required and therefore not implemented.
-
refreshPlot() [slot] Triggers an update of the current plot window.
-
getPlotID() [slot] Return window ID of this plot {int}.
5.4.3.5. Signals
-
pickerChanged(pickerIndex, positionX, positionY, curveIndex) [signal] This signal is emitted whenever the current picker changed its position
- Parameters
Note
To connect to this signal use the following signature:
yourItem.connect('pickerChanged(int,double,double,int)', yourMethod)
-
geometricShapeCurrentChanged(currentShape) [signal] This signal is emitted whenever the currently selected geometric has been changed
- Parameters
currentShape (shape) – new current shape or an invalid shape if the current shape has been deleted and no other shape is selected now
Note
To connect to this signal use the following signature:
yourItem.connect('geometricShapeCurrentChanged(ito::Shape)', yourMethod)
-
geometricShapeFinished(shapes, aborted) [signal] This signal is emitted whenever one or multiple geometric shapes have been added, removed or modified
- Parameters
shapes (tuple of shape) – A tuple containing all shapes that have been modified
aborted (bool) – True if the modification process has been aborted, else False
Note
To connect to this signal use the following signature:
yourItem.connect('geometricShapeFinished(QVector<ito::Shape>,bool)', yourMethod)
-
geometricShapesDeleted() [signal] This signal is emitted when the last geometric shape has been deleted or removed.
Note
To connect to this signal use the following signature:
yourItem.connect('geometricShapesDeleted()', yourMethod)
-
geometricShapeDeleted(idx) [signal] This signal is emitted whenever a geometric shape has been deleted
- Parameters
idx (int) – index of the deleted shape
Note
To connect to this signal use the following signature:
yourItem.connect('geometricShapeDeleted(int)', yourMethod)
-
geometricShapeChanged(idx, shape) [signal] This signal is emitted whenever a geometric shape has been changed (e.g. its position or form has been changed)
- Parameters
Note
To connect to this signal use the following signature:
yourItem.connect('geometricShapeChanged(int,ito::Shape)', yourMethod)
-
geometricShapeAdded(idx, shape) [signal] This signal is emitted whenever a geometric shape has been added
- Parameters
Note
To connect to this signal use the following signature:
yourItem.connect('geometricShapeAdded(int,ito::Shape)', yourMethod)
-
userInteractionDone(type, aborted, shapes) [signal] This signal is emitted if the user finished adding the requested number of shapes or aborted the process by pressing the Esc key
This signal is only emitted if the user interaction has been started by the slot userInteractionStart or by plotItem.drawAndPickElements.
- Parameters
type (int) – type of the shapes that have been recently added (e.g. shape.Line, shape.Point, shape.Rectangle, …)
aborted (bool) – True if the user aborted the process by pressing the Esc key before having added the total number of requested shapesshapes : {list of shape} list of shapes that have been added.
Note
To connect to this signal use the following signature:
yourItem.connect('userInteractionDone(int,bool,QVector<ito::Shape>)', yourMethod)
-
geometricShapeStartUserInput(type, userInteractionReason) [signal] This signal is emitted whenever the plot enters a mode where the user can add a new geometric shape using the mouse
- Parameters
type (int) – Type of the shape that could be added by the user, this is one of the constants shape.Circle, shape.Ellipse, shape.Line…
userInteractionReason (bool) – True if the process to add a new shape has been initialized by a script-base call, False if it has been started by a button in the toolbar or menu of the plot
Note
To connect to this signal use the following signature:
yourItem.connect('geometricShapeStartUserInput(int,bool)', yourMethod)
-
windowTitleModified(windowTitleSuffix) [signal] signature for connection to this signal: windowTitleModified(QString)
5.4.4. Deprecated figures
The plot-dll “itom1DQWTFigure” is deprecated and has been replaced by “Itom1DQwtPlot”.