5.3. Plot classes and default plots
Per default, itom comes with a set of various plot types allowing to show data as 1D line plot, 2D image plot with scaled colors, 2.5D isometric plot, 3D plot of point clouds and polygon meshes among others. However, itom is designed such that arbitrary plot plugins can be created and integrated. Every plot plugin is programmed in a similar way than other itom plugins, but follows the rules of a Qt designer plugin, such that the plot can also be integrated in user defined GUIs.
In order to keep this plot plugins organized, itom comes with a set of plot categories which define some common types of data and visualization. Every plot plugin has to indicate the categories it belongs to and is able to show data that corresponds to the requirements of a category. While it is possible to independently choose a plot plugin as argument of every plot command, it is also possible to define default plot plugins for every category, such that these defaults are always chosen if a certain type of data should be visualized without further information about the desired plot plugin.
A list of all available plot plugins can be found in the section Plots and Figures >> Default Plots of the property dialog of itom.
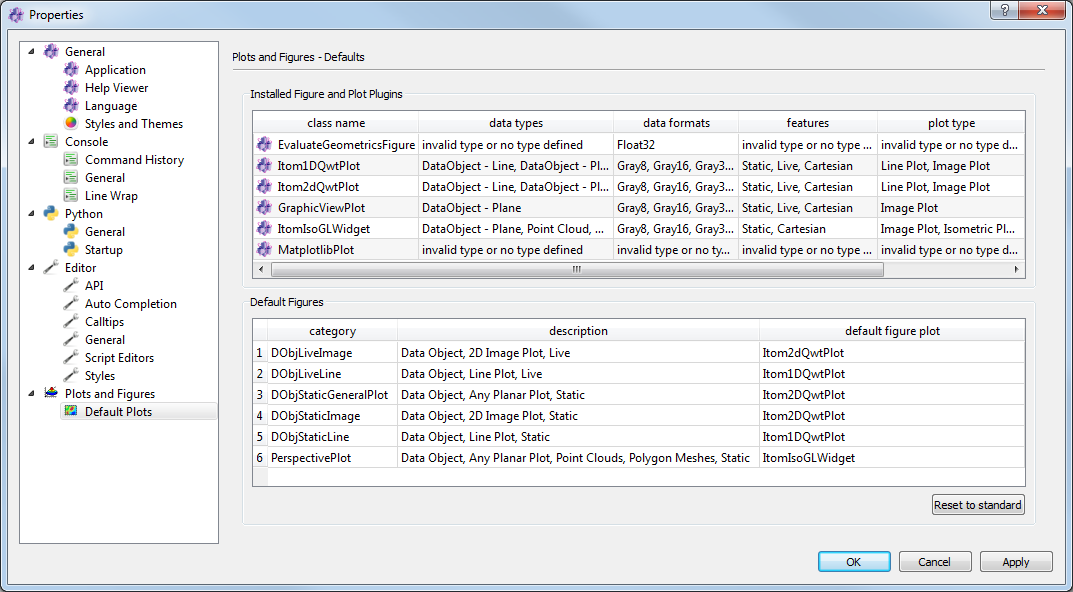
The list Installed Figure and Plot Plugins list all plot plugins (library files within the folder designer of the itom build or installation directory). Every row stands for one detected plot plugin with the following meaning:
- class name: This is the class name of the plot which can be used for instance in the commands
plot()orliveImage()to select this plot plugin for visualizing the required data (if the plot plugin supports the given input data)
- class name: This is the class name of the plot which can be used for instance in the commands
data types: Data types, the plot plugin supports (e.g. DataObject - Line, DataObject - Plane, Point Cloud …)
data formats: The point type of a dataObject or pointCloud that is supported by the plot
features: Features the plot plugin is able to display, for instance the type of coordinate system is indicated or if the plot is able to show static data or live data from grabbers, too.
If a library file in the designer folder does not appear in this list, it can have two reasons:
The library is a Qt designer plugin, but does not implement the interface for itom plot plugins. Then, it can be used as general widget in user defined GUIs, but not as plot class.
There might be any load issue (for instance, the plot plugin depends on other libraries that could not be found…). In this case, see the load state in the dialog Loaded plugins (menu file in the main window of itom).
In the second table (Default figures), there are six different categories together with the current default plot class that is used if input data, that fits to a certain category, should be displayed and no specific plot class is indicated. To change the default plot class of any category, click the cell in the last column and select a plot class from the displayed combo box. If no entry is visible in the combo box, no plot plugin is available, that pretends to support the required features, data types and formats of the category.
5.3.1. Plot class selection
If one of the commands plot() or liveImage() are used to visualize a static dataObject, pointCloud … or
to show a live image of any camera, it is possible to let itom automatically choose the right plot class or one can select a plot class:
Automatic selection
If the commands are used without indicating the optional parameter className, itom analyzes the given data and tries to find the right category. Then, the plot is opened with the corresponding default plot class. If no possible plot class could be found, an error is displayed.
Plot class selection
Set the optional parameter className to a specific class name of a plot plugin. If the data can be opened by this plot class (depending on data type, data format and features), it is shown using the desired plot class. Else, the default plot class for the given type of data is used (a warning is displayed in this case). In the following example a random 2D dataObject with float32 is created and should be displayed using the plot class itom2dqwtplot. This is possible, since itom2dqwtplot is able to display dataObjects in an image (plane) representation.
1 2 3 | data = dataObject.randN([124,124],'float32')
plot(data, 'itom2dqwtplot')
#the class name is case insensitive
|
Category selection
In order to simplify the selection of plot classes, it is also possible to use the abbreviations for some categories. Possible keywords are:
‘1d’ for the categories DObjLiveLine or DObjStaticLine (hence displaying any live or static dataObject in a line plot with one or more lines)
‘2d’ for the categories DObjLiveImage or DObjStaticImage (the same in a 2D image plot)
‘2.5d’ for the category PerspectivePlot which visualizes dataObjects in a 2.5D representation (isometric plot)
In the following example, the dataObject with two rows should be visualized in a 1D plot, such that both rows are displayed as two lines. If the className parameter would have been omitted, itom would have recognized the dataObject as 2D matrix and use the default plot from the category DObjStaticImage as plot plugin. Here, the keyword ‘1d’ forces itom to use the default from the category DObjStaticLine instead:
1 2 | data = dataObject.randN([2,200],'float32')
plot(data, '1d')
|