Note
Click here to download the full example code
12.1.10.5.7. Datetime
This demo shows how the x-axis of a 1d plot can be a date time.
import numpy as np
import datetime
from itom import dataObject
from itom import plot1
Start date with a specific timezone.
timestamp = datetime.datetime(
    2022, 5, 6, 12, 23, 5, tzinfo=datetime.timezone(datetime.timedelta(0, -7200))
)
Create a list of datetime.datetime objects.
numsteps = 100
dateList = []

for x in range(0, numsteps, 15):
    dateList.append(
        timestamp + datetime.timedelta(hours=x)
    )
Create a dataObject from the list of datetime objects.
dateScale = dataObject([1, len(dateList)], "datetime", data=dateList)

values = dataObject.randN(dateScale.shape, "float32")

[i, h] = plot1(values, dateScale)
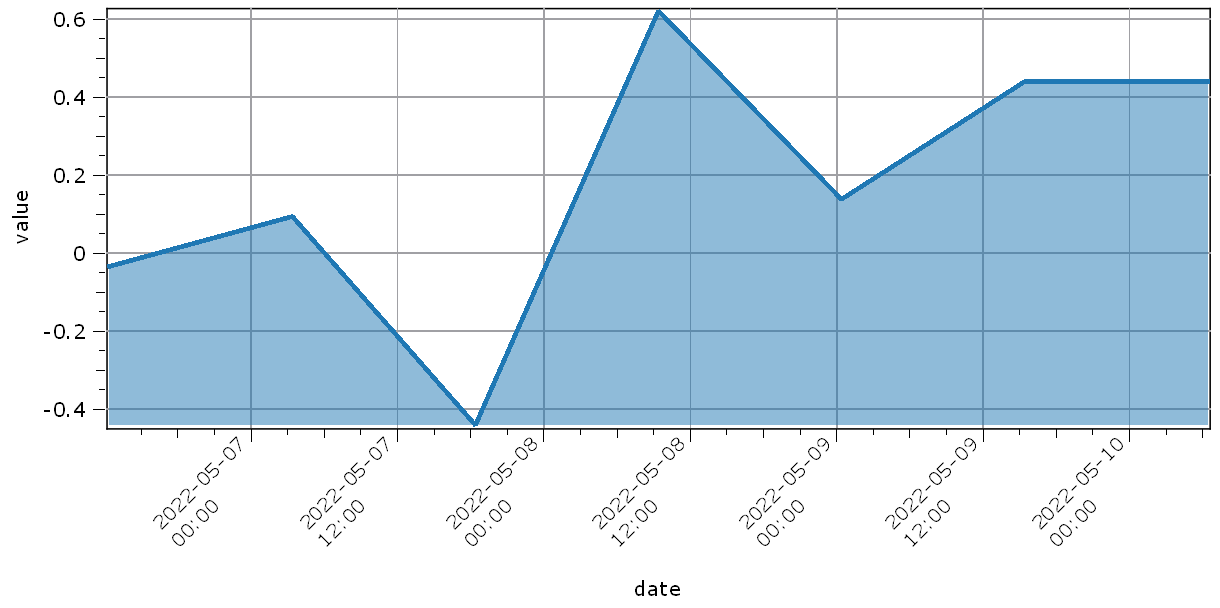
h["lineWidth"] = 3
h["axisLabelRotation"] = -45
h["axisLabelAlignment"] = "AlignLeft"
h["fillCurve"] = "FillFromBottom"
h["grid"] = "GridMajorXY"
h["axisLabel"] = "date"
h["valueLabel"] = "value"
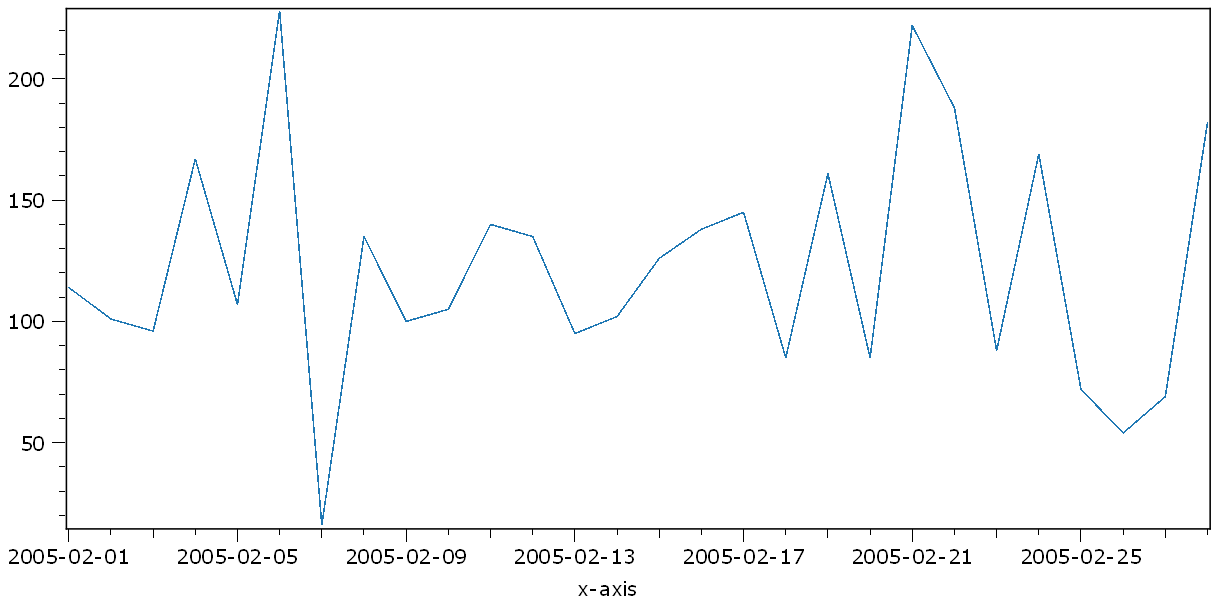
Example with numpy datetime array.
dateScale = np.arange('2005-02', '2005-03', dtype='datetime64[D]')
values = dataObject.randN([1, len(dateScale)], "uint8")
plot1(values, dateScale)
(130, PlotItem(UiItem(class: Itom1DQwtPlot, name: plot0x0)))
Total running time of the script: ( 0 minutes 0.290 seconds)