Note
Click here to download the full example code
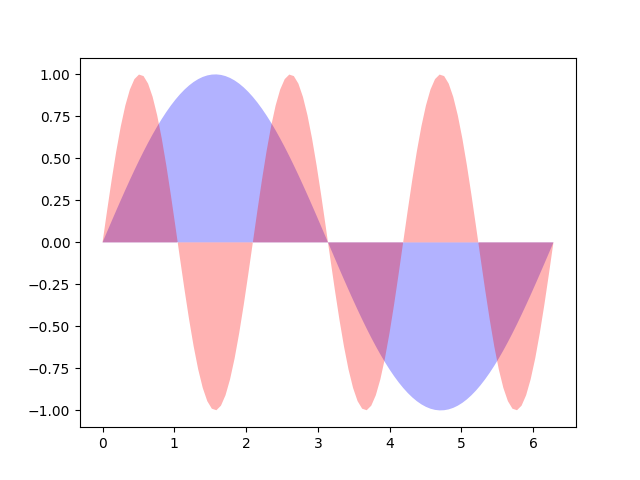
12.3.10.1.1. Fill features
Demo of the fill function with a few features.
In addition to the basic fill plot, this demo shows a few optional features:
Multiple curves with a single command.
Setting the fill color.
Setting the opacity (alpha value).
import numpy as np
import matplotlib.pyplot as plt

plt.figure()
x = np.linspace(0, 2 * np.pi, 100)
y1 = np.sin(x)
y2 = np.sin(3 * x)
plt.fill(x, y1, "b", x, y2, "r", alpha=0.3)
plt.show()
Total running time of the script: ( 0 minutes 0.102 seconds)