Note
Click here to download the full example code
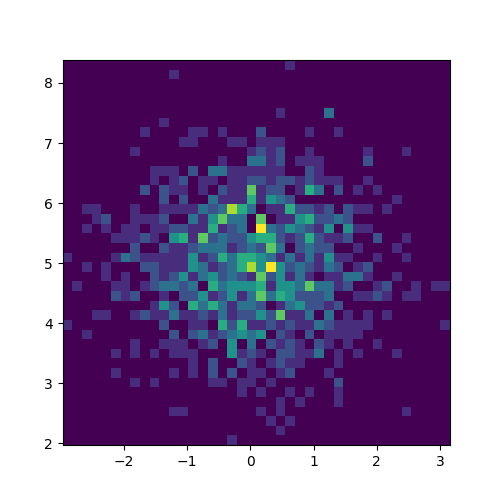
12.3.10.1.10. Histogram 2D size control
import matplotlib.pyplot as plt
import numpy as np

x = np.random.randn(1000)
y = np.random.randn(1000) + 5

plt.figure()
# normal distribution center at x=0 and y=5
plt.hist2d(x, y, bins=40)
plt.show()

# get current figure
current_figure = plt.gcf()

# set the keepSizeFixed property of the plot to true:
# current_figure.canvas.manager.itomUI["keepSizeFixed"] = True
# alternative:
# plt.get_current_fig_manager().itomUI["keepSizeFixed"]

# change the size
current_figure.set_dpi(120)
current_figure.set_size_inches(5, 5, forward=True)
Total running time of the script: ( 0 minutes 0.072 seconds)