Note
Click here to download the full example code
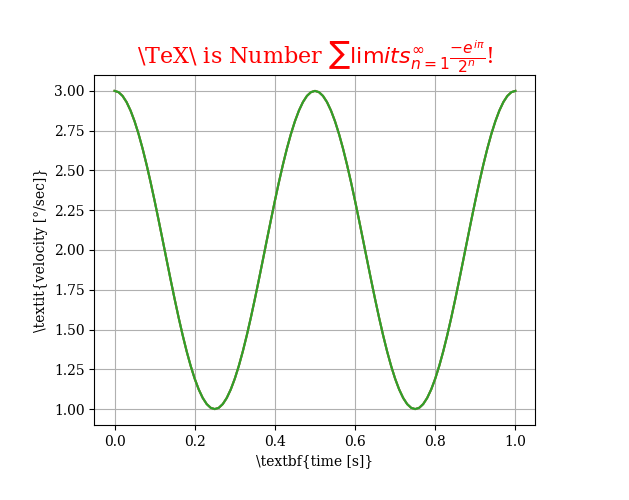
12.3.10.1.21. Tex
import matplotlib
import matplotlib.pyplot as plt
from matplotlib import rc
import numpy as np

# http://matplotlib.org/users/customizing.html
# matplotlib.rcParams["text.latex.unicode"] = True  # latex unicode
matplotlib.rcParams["font.family"] = "serif"
# matplotlib.rcParams["text.latex.preamble"] = [r"\usepackage{lmodern}"]
rc("text", usetex=True)

def plot_figure(title: str, xLabel: str, yLabel: str, usetex: bool):
    plt.figure(1, figsize=(6.29921, 5))  # create a new figure window
    # ax = plt.axes([0.1, 0.1, 0.8, 0.7])
    t = np.arange(0.0, 1.0 + 0.01, 0.01)
    s = np.cos(2 * 2 * np.pi * t) + 2

    plt.plot(t, s)  # plot line

    plt.xlabel(xLabel)  # x axis label
    plt.ylabel(yLabel)  # y axis label
    plt.title(title, fontsize=16, color="r")  # title

    plt.grid(True)  # create grid

    spaceToBorder = 0.15
    plt.subplots_adjust(
        left=spaceToBorder,
        right=1 - spaceToBorder,
        top=1 - spaceToBorder,
        bottom=spaceToBorder,
    )  # adjust the space to the border of the figure

    plt.show()  # show the plot

    # get current figure
    current_figure = plt.gcf()

    # set the keepSizeFixed property of the plot to true:
    # current_figure.canvas.manager.itomUI["keepSizeFixed"] = True

    # change the size
    current_figure.set_dpi(120)
    current_figure.set_size_inches(
        6.29921, 5, forward=True
    )  # 6.29921 inches are 16mm width of a DIN A4 page
    plt.show()
    # plt.savefig("matplotlib.png", format="png")


matplotlib.rcParams["text.usetex"] = False
# matplotlib.rcParams["text.latex.unicode"] = False
title = "TeX is Number $\sum_{n=1}^\infty \frac{-e^{i\pi}}{2^n}$!"
xLabel = "time [s]"
yLabel = "velocity [\xb0/sec]"
plot_figure(title, xLabel, yLabel, False)

matplotlib.rcParams["text.usetex"] = True
# matplotlib.rcParams["text.latex.unicode"] = False
title = r"\TeX\ is Number $\sum\limits_{n=1}^\infty \frac{-e^{i\pi}}{2^n}$!"
xLabel = r"time [s]"
yLabel = r"\textit{velocity [\ensuremath{^\circ}/sec]}"
plot_figure(title, xLabel, yLabel, True)


matplotlib.rcParams["text.usetex"] = True
# matplotlib.rcParams["text.latex.unicode"] = True
title = r"\TeX\ is Number $\sum\limits_{n=1}^\infty \frac{-e^{i\pi}}{2^n}$!"
xLabel = r"\textbf{time [s]}"
yLabel = u"\\textit{velocity [\xb0/sec]}"
plot_figure(title, xLabel, yLabel, True)
Total running time of the script: ( 0 minutes 0.157 seconds)