Note
Click here to download the full example code
12.3.10.1.5. Streamplot
Demo of the streamplot function.
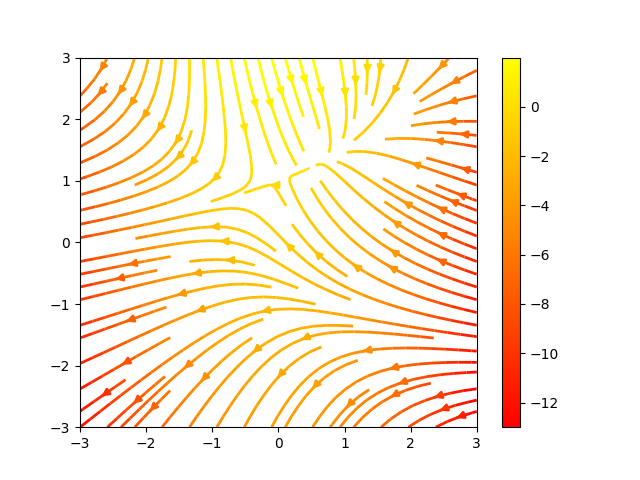
A streamplot, or streamline plot, is used to display 2D vector fields. This example shows a few features of the stream plot function:
Varying the color along a streamline.
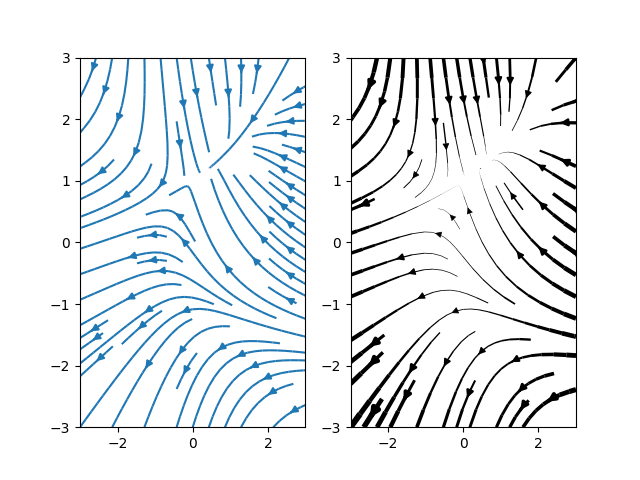
Varying the density of streamlines.
Varying the line width along a stream line.
import numpy as np
import matplotlib.pyplot as plt

Y, X = np.mgrid[-3:3:100j, -3:3:100j]
U = -1 - X ** 2 + Y
V = 1 + X - Y ** 2
speed = np.sqrt(U * U + V * V)

plt.streamplot(X, Y, U, V, color=U, linewidth=2, cmap=plt.cm.autumn)
plt.colorbar()

f, (ax1, ax2) = plt.subplots(ncols=2)
ax1.streamplot(X, Y, U, V, density=[0.5, 1])

lw = 5 * speed / speed.max()
ax2.streamplot(X, Y, U, V, density=0.6, color="k", linewidth=lw)

plt.show()
Total running time of the script: ( 0 minutes 1.686 seconds)