Note
Click here to download the full example code
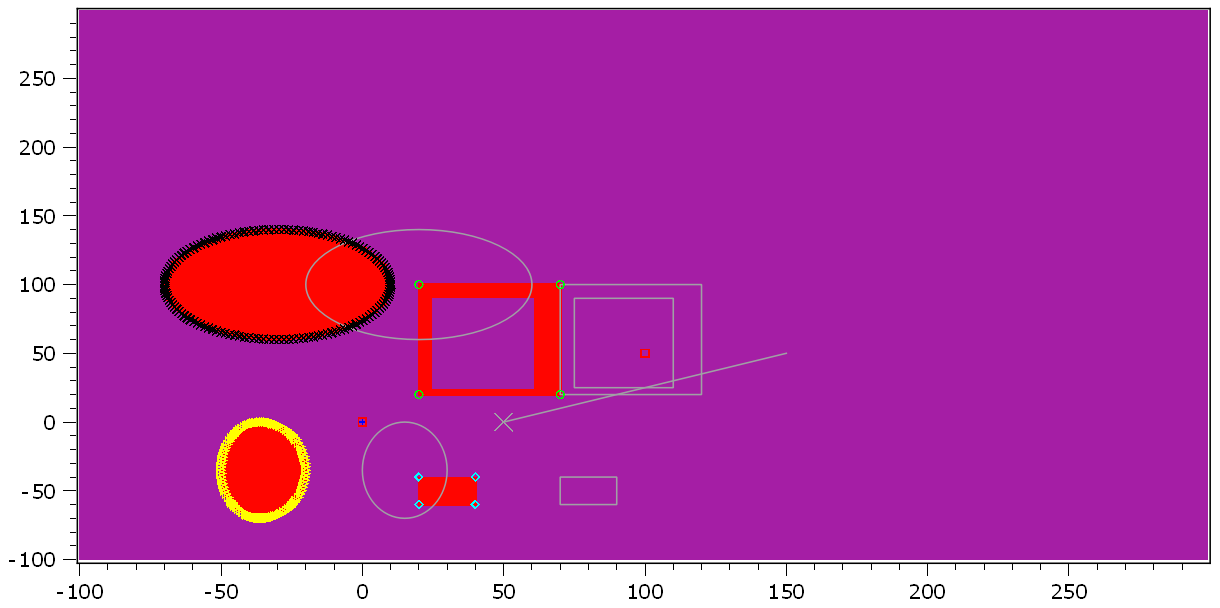
12.1.10.5.15. Shapes
This demo shows how you can add different shapes in the itom plot.
from itom import shape
from itom import region
from itom import dataObject
from itom import plot
Create unrotated shapes.
point = shape(shape.Point, (0, 0))
print(point)
line = shape(shape.Line, (0, 0), (100, 50))
print(line)
rect = shape(shape.Rectangle, (20, 20), (70, 100))
print(rect)
innerRect = shape(shape.Rectangle, (25, 25), (60, 90))
print(innerRect)
square = shape(shape.Square, (30, -50), 20)
print(square)
ellipse = shape(shape.Ellipse, (-50, -70), (-20, 0))
print(ellipse)
circle = shape(shape.Circle, (-30, 100), 40)
print(circle)
shape(Point, (0, 0), index: -1)
shape(Line, (0, 0) - (100, 50), index: -1)
shape(Rectangle, (20, 20) - (70, 100), index: -1)
shape(Rectangle, (25, 25) - (60, 90), index: -1)
shape(Square, center (30, -50), l: 10, index: -1)
shape(Ellipse, center (-35, -35), (a=15, b=35), index: -1)
shape(Circle, center (-30, 100), r: 40, index: -1)
Create a pixel-based region from all shapes (union of all shapes).
area = region()
area += point.region()
area += line.region()
area += rect.region()
area -= innerRect.region()
area += square.region()
area += ellipse.region()
area += circle.region()
mask = area.createMask(region(-100, -100, 300, 300, region.RECTANGLE))
Create the mask for a dataObject based on the shapes.
image = dataObject.zeros([400, 400], "uint8")
image.axisOffsets = (100, 100)
mask = image.createMask(
    [point, line, rect, square, ellipse, circle]
) & image.createMask([innerRect], True)

# plot all contours inside of plot
area = region()
contour_point = point.contour()
contour_line = line.contour()
contour_rect = rect.contour()
contour_square = square.contour()
contour_ellipse = ellipse.contour(tol=0.02)
contour_circle = circle.contour(tol=0.01)
Plot mask and contour points
[i, h] = plot(mask, "2D", properties={"colorMap": "falseColorIR"})
h.call("plotMarkers", contour_point, "b+")
h.call("plotMarkers", contour_line, "rs")
h.call("plotMarkers", contour_rect, "g.")
h.call("plotMarkers", contour_square, "cd")
h.call("plotMarkers", contour_ellipse, "y>")
h.call("plotMarkers", contour_circle, "kx")

# plot shapes into plot
# move them first by 50px each
for s in [point, line, rect, square, innerRect, ellipse, circle]:
    s.center = [s.center[0] + 50, s.center[1]]

# don't allow the rectangle to be moved
rect.flags = shape.MoveLock

# don't allow the line to be resized
line.flags = shape.ResizeLock

# don't allow the line to be resized, moved and rotated
line.flags = shape.MoveLock | shape.ResizeLock | shape.RotateLock

h["geometricShapes"] = [
    point,
    line,
    rect,
    innerRect,
    square,
    ellipse,
    circle,
]
Total running time of the script: ( 0 minutes 0.228 seconds)